

doi: 10.1038/nmeth.1896.
OMERO: flexible, model-driven data management for experimental biology
Affiliations
- PMID: 22373911
- PMCID: PMC3437820
- DOI: 10.1038/nmeth.1896
Item in Clipboard
OMERO: flexible, model-driven data management for experimental biology
Nat Methods.
.
Abstract
Data-intensive research depends on tools that manage multidimensional, heterogeneous datasets. We built OME Remote Objects (OMERO), a software platform that enables access to and use of a wide range of biological data. OMERO uses a server-based middleware application to provide a unified interface for images, matrices and tables. OMERO's design and flexibility have enabled its use for light-microscopy, high-content-screening, electron-microscopy and even non-image-genotype data. OMERO is open-source software, available at http://openmicroscopy.org/.
Figures
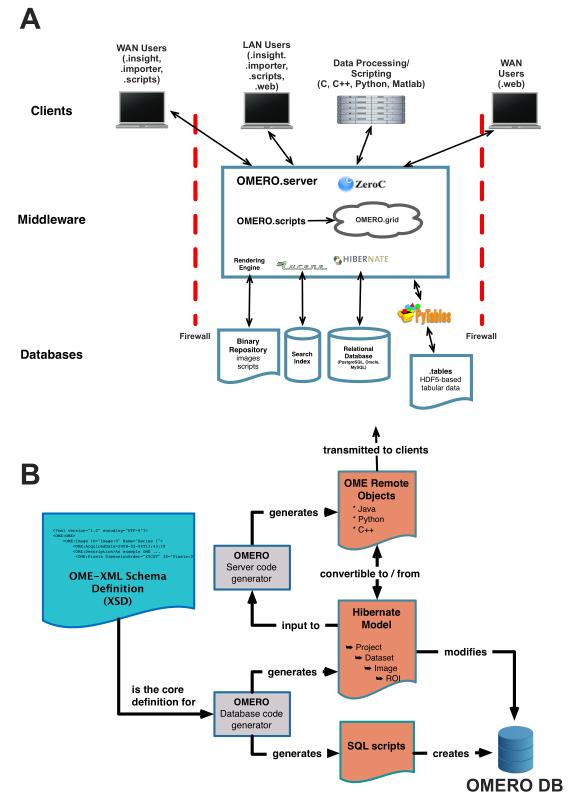
(A) OMERO Architecture. OMERO is built from a series of database, middleware and client applications. A number of open source libraries provide critical functionality: Hibernate is used for object-relational mapping, Lucene for indexing, Pytables for linking to HDF5 files, and ICE for remoting. (B) Use of OME Data Model for Code Generation. OME-XML is used by OMERO code generators to generate the OMERO relational database, the object-relational mapping model and the ICE-based remoting system.
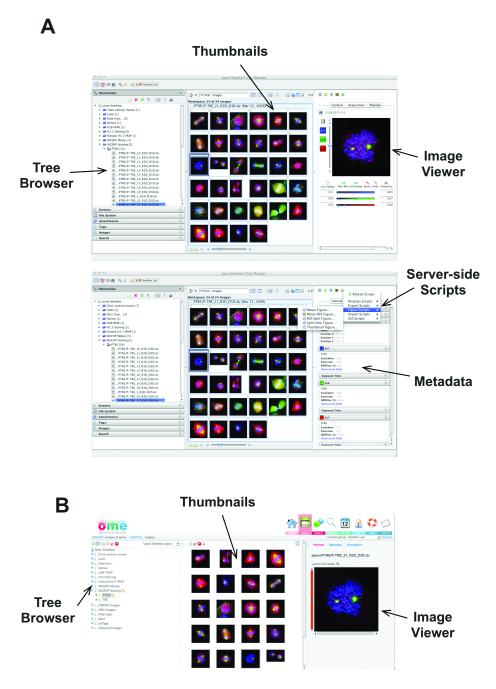
(A) Different views of OMERO.insight showing the tree-based data browser, image thumbnails, and a view of a single image (top) and image metadata and annotations and access to server-side analysis scripts (bottom). (B) OMERO.web client viewing same data as in (A).
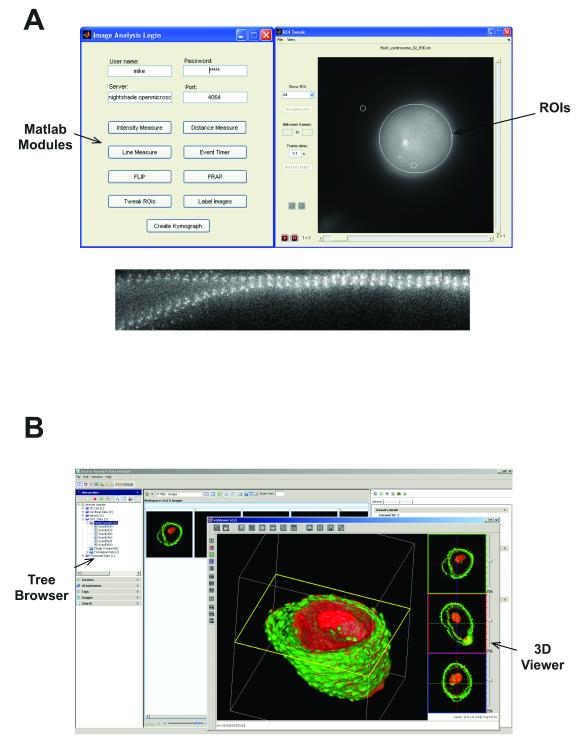
(A) Screenshots of custom applications written in Matlab that define and measure features of ROIs based on Otsu thresholding or calculate kymographs based on a user-defined region. Any processing or analysis facility within Matlab can be used for data stored within OMERO. (B) VolViewer, a 3D GPU-based multi-channel volume rendering engine viewing image data obtained from an OMERO installation. VolViewer requires a GPU for processing, but implementations using VolViewer as a client of OMERO, or running as an OMERO service on a server with a GPU are available.
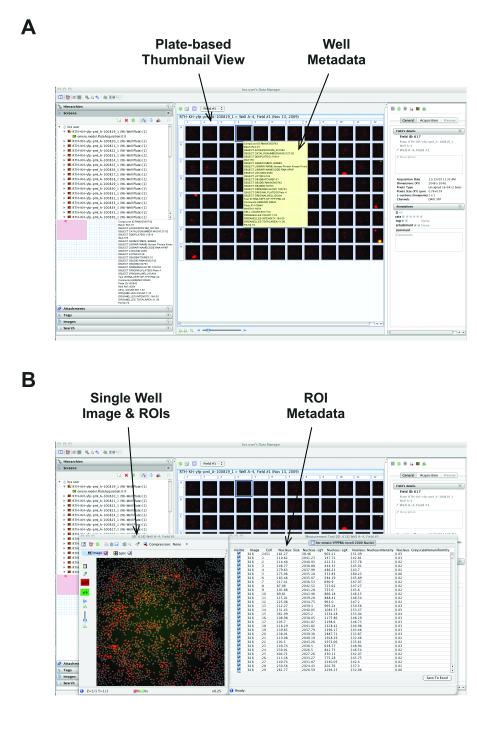
(A) Screenshot of OMERO.insight showing data from a targeted siRNA screen recorded on an InCell 1000 platform. Images are stored in OMERO’s file store and acquisition metadata are stored in the OMERO relational database. Experimental metadata defining gene name, siRNA and other experimental parameters were originally stored in CSV files and imported into OMERO using the Annotation service, and stored in the OMERO.tables HDF5-based store. (B) Screenshot of OMERO.insight showing view of data of single field from single well from dataset in (A). Choosing any well thumbnail opens an image view window (Fig. 4B), and viewing the measurements in that image reveals ROIs calculated by proprietary software on the InCell platform, stored in the OMERO DB and visualised as overlays on the displayed image. Calculated features from each ROI are stored in the OMERO.tables HDF5-based store, and displayed alongside the ROIs.
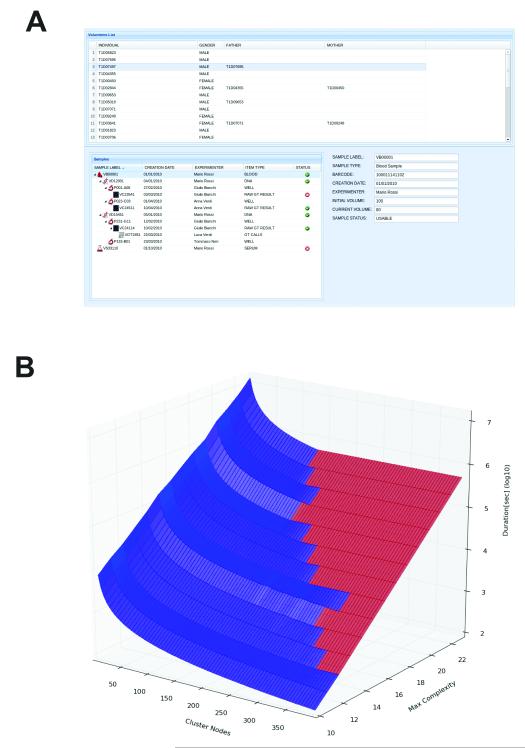
(A) Alternative use of OMERO for storing and tracking clinical laboratory specimens and genotype data. Sample type, creation date, processing, assay results, genotyping results, and any familial relationships are all recorded. The modelling for this system is based on OpenEHR archetypes. See Supplemental Note for more details. (B) Performance of a SNP imputing calculation as a function of pedigree complexity (an index of the number of members of a genetically related family) and compute nodes used to perform the calculation. Low complexity imputation benefits from increasing the number of compute nodes, and only occupies nodes for relatively short periods. High complexity calculations take orders of magnitude longer, and do not benefit from adding more nodes. The point where adding number of nodes provides no improvement in performance is shown by the interface between the blue and red domains. Time and cost-efficient use of compute resources therefore depends on access to metadata, determination of complexity, and planning of processing strategy before initiating the imputing calculation.
References
Publication types
MeSH terms
Grants and funding
- BB/I000755/BB_/Biotechnology and Biological Sciences Research Council/United Kingdom
- BB/I000755/1/BB_/Biotechnology and Biological Sciences Research Council/United Kingdom
- BB/I001662/1/BB_/Biotechnology and Biological Sciences Research Council/United Kingdom
- BB/G022577/1/BB_/Biotechnology and Biological Sciences Research Council/United Kingdom
- 085982/WT_/Wellcome Trust/United Kingdom
LinkOut - more resources
Full Text Sources
Other Literature Sources
