Co-evolution of segregation guide DNA motifs and the FtsK translocase in bacteria: identification of the atypical Lactococcus lactis KOPS motif
- PMID: 22373923
- PMCID: PMC3384302
- DOI: 10.1093/nar/gks171
Co-evolution of segregation guide DNA motifs and the FtsK translocase in bacteria: identification of the atypical Lactococcus lactis KOPS motif
Abstract
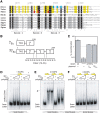
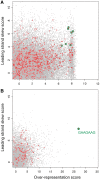
Bacteria use the global bipolarization of their chromosomes into replichores to control the dynamics and segregation of their genome during the cell cycle. This involves the control of protein activities by recognition of specific short DNA motifs whose orientation along the chromosome is highly skewed. The KOPS motifs act in chromosome segregation by orienting the activity of the FtsK DNA translocase towards the terminal replichore junction. KOPS motifs have been identified in γ-Proteobacteria and in Bacillus subtilis as closely related G-rich octamers. We have identified the KOPS motif of Lactococcus lactis, a model bacteria of the Streptococcaceae family harbouring a compact and low GC% genome. This motif, 5'-GAAGAAG-3, was predicted in silico using the occurrence and skew characteristics of known KOPS motifs. We show that it is specifically recognized by L. lactis FtsK in vitro and controls its activity in vivo. L. lactis KOPS is thus an A-rich heptamer motif. Our results show that KOPS-controlled chromosome segregation is conserved in Streptococcaceae but that KOPS may show important variation in sequence and length between bacterial families. This suggests that FtsK adapts to its host genome by selecting motifs with convenient occurrence frequencies and orientation skews to orient its activity.
Figures


Similar articles
-
KOPS: DNA motifs that control E. coli chromosome segregation by orienting the FtsK translocase.EMBO J. 2005 Nov 2;24(21):3770-80. doi: 10.1038/sj.emboj.7600835. Epub 2005 Oct 6. EMBO J. 2005. PMID: 16211009 Free PMC article.
-
Single-molecule imaging of DNA curtains reveals mechanisms of KOPS sequence targeting by the DNA translocase FtsK.Proc Natl Acad Sci U S A. 2012 Apr 24;109(17):6531-6. doi: 10.1073/pnas.1201613109. Epub 2012 Apr 9. Proc Natl Acad Sci U S A. 2012. PMID: 22493241 Free PMC article.
-
Oriented loading of FtsK on KOPS.Nat Struct Mol Biol. 2006 Nov;13(11):1026-8. doi: 10.1038/nsmb1159. Epub 2006 Oct 15. Nat Struct Mol Biol. 2006. PMID: 17041597
-
FtsK, a literate chromosome segregation machine.Mol Microbiol. 2007 Jun;64(6):1434-41. doi: 10.1111/j.1365-2958.2007.05755.x. Epub 2007 May 18. Mol Microbiol. 2007. PMID: 17511809 Review.
-
FtsK and SpoIIIE, coordinators of chromosome segregation and envelope remodeling in bacteria.Trends Microbiol. 2022 May;30(5):480-494. doi: 10.1016/j.tim.2021.10.002. Epub 2021 Oct 30. Trends Microbiol. 2022. PMID: 34728126 Review.
Cited by
-
vB_BcM_Sam46 and vB_BcM_Sam112, members of a new bacteriophage genus with unusual small terminase structure.Sci Rep. 2021 Jun 9;11(1):12173. doi: 10.1038/s41598-021-91289-x. Sci Rep. 2021. PMID: 34108535 Free PMC article.
-
SpoIIIE protein achieves directional DNA translocation through allosteric regulation of ATPase activity by an accessory domain.J Biol Chem. 2013 Oct 4;288(40):28962-74. doi: 10.1074/jbc.M113.484055. Epub 2013 Aug 25. J Biol Chem. 2013. PMID: 23974211 Free PMC article.
-
Missense Mutations Allow a Sequence-Blind Mutant of SpoIIIE to Successfully Translocate Chromosomes during Sporulation.PLoS One. 2016 Feb 5;11(2):e0148365. doi: 10.1371/journal.pone.0148365. eCollection 2016. PLoS One. 2016. PMID: 26849443 Free PMC article.
-
Xer Site Specific Recombination: Double and Single Recombinase Systems.Front Microbiol. 2017 Mar 20;8:453. doi: 10.3389/fmicb.2017.00453. eCollection 2017. Front Microbiol. 2017. PMID: 28373867 Free PMC article. Review.
-
Interplay between the Xer recombination system and the dissemination of antibioresistance in Acinetobacter baumannii.Nucleic Acids Res. 2025 Jan 7;53(1):gkae1255. doi: 10.1093/nar/gkae1255. Nucleic Acids Res. 2025. PMID: 39777461 Free PMC article.
References
-
- Rocha EP. The organization of the bacterial genome. Annu. Rev. Genet. 2008;42:211–233. - PubMed
-
- Touzain F, Petit MA, Schbath S, El Karoui M. DNA motifs that sculpt the bacterial chromosome. Nat. Rev. Microbiol. 2011;9:15–26. - PubMed
-
- Blattner F, Plunkett Gr, Bloch C, Perna N, Burland V, Riley M, Collado-Vides J, Glasner J, Rode C, Mayhew G, et al. The complete genome sequence of Escherichia coli K-12. Science. 1997;277:1453–1462. - PubMed
-
- Salzberg SL, Salzberg AJ, Kerlavage AR, Tomb JF. Skewed oligomers and origins of replication. Gene. 1998;217:57–67. - PubMed
Publication types
MeSH terms
Substances
LinkOut - more resources
Full Text Sources
Miscellaneous

