

Epigenetic modifications and chromosome conformations of the beta globin locus throughout development
- PMID: 22374078
- PMCID: PMC3398168
- DOI: 10.1007/s12015-012-9355-x
Epigenetic modifications and chromosome conformations of the beta globin locus throughout development
Abstract
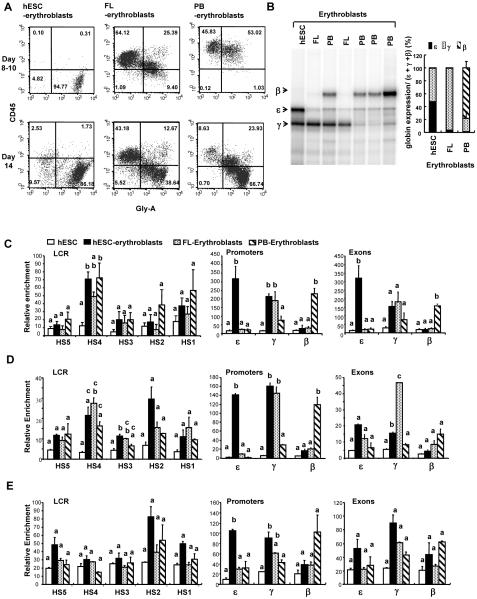
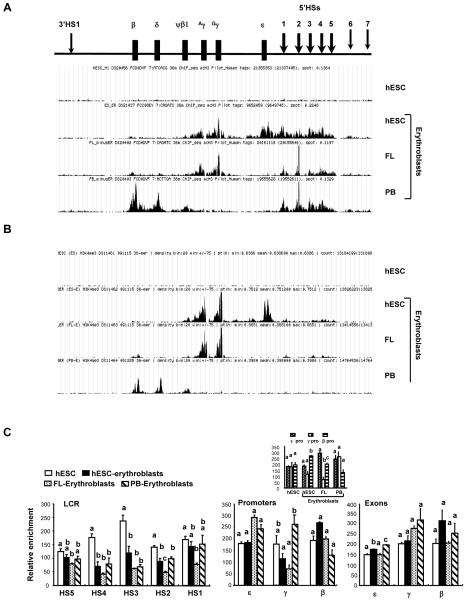
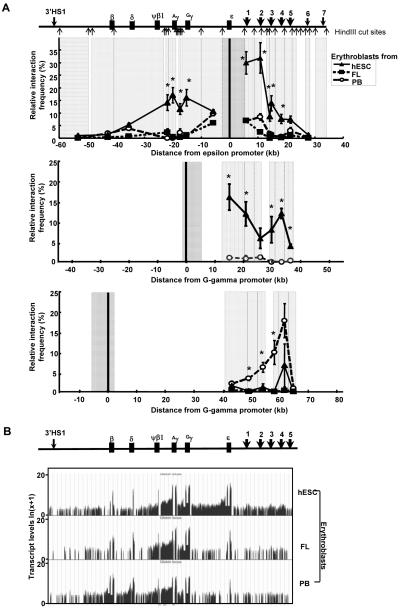
Human embryonic stem cells provide an alternative to using human embryos for studying developmentally regulated gene expression. The co-expression of high levels of embryonic ε and fetal γ globin by the hESC-derived erythroblasts allows the interrogation of ε globin regulation at the transcriptional and epigenetic level which could only be attained previously by studying cell lines or transgenic mice. In this study, we compared the histone modifications across the β globin locus of the undifferentiated hESCs and hESC-, FL-, and mobilized PB CD34(+) cells-derived erythroblasts, which have distinct globin expression patterns corresponding to their developmental stages. We demonstrated that the histone codes employed by the β globin locus are conserved throughout development. Furthermore, in spite of the close proximity of the ε globin promoter, as compared to the β or γ globin promoter, with the LCR, a chromatin loop was also formed between the LCR and the active ε globin promoter, similar to the loop that forms between the β or γ globin promoters and the LCR, in contrary to the previously proposed tracking mechanism.
Figures
Similar articles
-
Transcriptional environment and chromatin architecture interplay dictates globin expression patterns of heterospecific hybrids derived from undifferentiated human embryonic stem cells or from their erythroid progeny.Exp Hematol. 2013 Nov;41(11):967-979.e6. doi: 10.1016/j.exphem.2013.08.005. Epub 2013 Aug 28. Exp Hematol. 2013. PMID: 23993951 Free PMC article.
-
All of the human beta-type globin genes compete for LCR enhancer activity in embryonic erythroid cells of yeast artificial chromosome transgenic mice.FASEB J. 2009 Dec;23(12):4335-43. doi: 10.1096/fj.09-137778. Epub 2009 Aug 18. FASEB J. 2009. PMID: 19690216 Free PMC article.
-
DNase I hypersensitivity and epsilon-globin transcriptional enhancement are separable in locus control region (LCR) HS1 mutant human beta-globin YAC transgenic mice.J Biol Chem. 2010 May 7;285(19):14495-503. doi: 10.1074/jbc.M110.116525. Epub 2010 Mar 15. J Biol Chem. 2010. PMID: 20231293 Free PMC article.
-
Chromatin loop formation in the β-globin locus and its role in globin gene transcription.Mol Cells. 2012 Jul;34(1):1-5. doi: 10.1007/s10059-012-0048-8. Epub 2012 May 18. Mol Cells. 2012. PMID: 22610406 Free PMC article. Review.
-
Epigenetic regulation of fetal globin gene expression in adult erythroid cells.Transl Res. 2015 Jan;165(1):115-25. doi: 10.1016/j.trsl.2014.05.002. Epub 2014 May 11. Transl Res. 2015. PMID: 24880147 Free PMC article. Review.
Cited by
-
Transcriptome dynamics during human erythroid differentiation and development.Genomics. 2013 Nov-Dec;102(5-6):431-441. doi: 10.1016/j.ygeno.2013.09.005. Epub 2013 Oct 8. Genomics. 2013. PMID: 24121002 Free PMC article.
-
Exploring epigenetic and microRNA approaches for γ-globin gene regulation.Exp Biol Med (Maywood). 2021 Nov;246(22):2347-2357. doi: 10.1177/15353702211028195. Epub 2021 Jul 22. Exp Biol Med (Maywood). 2021. PMID: 34292080 Free PMC article. Review.
-
Genetic Modifiers of Hemoglobin Expression from a Clinical Perspective in Hemoglobinopathy Patients with Beta Thalassemia and Sickle Cell Disease.Int J Mol Sci. 2024 Nov 5;25(22):11886. doi: 10.3390/ijms252211886. Int J Mol Sci. 2024. PMID: 39595957 Free PMC article. Review.
-
α-Globin as a molecular target in the treatment of β-thalassemia.Blood. 2015 Jun 11;125(24):3694-701. doi: 10.1182/blood-2015-03-633594. Epub 2015 Apr 13. Blood. 2015. PMID: 25869286 Free PMC article. Review.
-
Transcriptional environment and chromatin architecture interplay dictates globin expression patterns of heterospecific hybrids derived from undifferentiated human embryonic stem cells or from their erythroid progeny.Exp Hematol. 2013 Nov;41(11):967-979.e6. doi: 10.1016/j.exphem.2013.08.005. Epub 2013 Aug 28. Exp Hematol. 2013. PMID: 23993951 Free PMC article.
References
Publication types
MeSH terms
Substances
Grants and funding
LinkOut - more resources
Full Text Sources
Other Literature Sources
Molecular Biology Databases
