. 2012 Feb;24(2):738-61.
doi: 10.1105/tpc.111.090431. Epub 2012 Feb 28.

Transcriptome sequencing identifies SPL7-regulated copper acquisition genes FRO4/FRO5 and the copper dependence of iron homeostasis in Arabidopsis

Affiliations

Transcriptome sequencing identifies SPL7-regulated copper acquisition genes FRO4/FRO5 and the copper dependence of iron homeostasis in Arabidopsis

María Bernal et al. Plant Cell. 2012 Feb.

Abstract

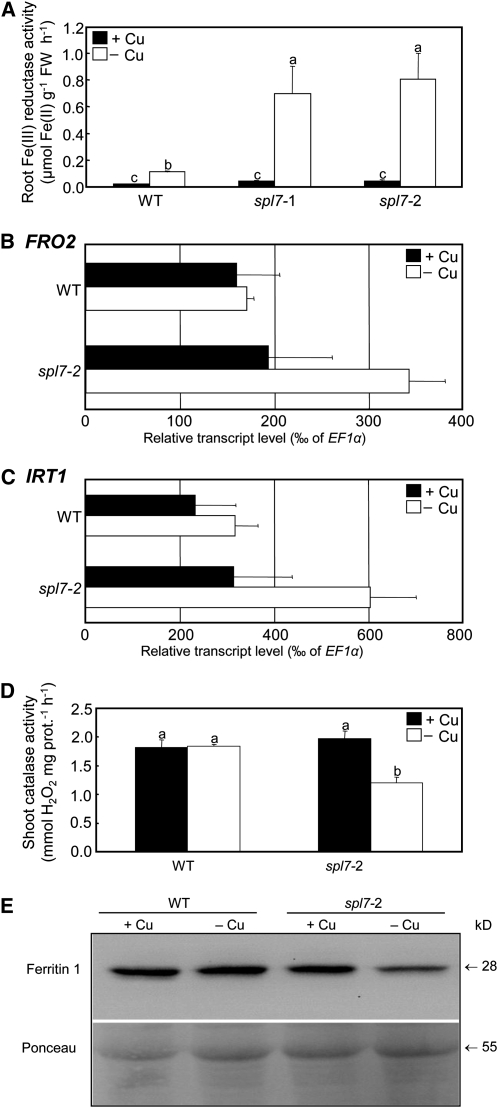
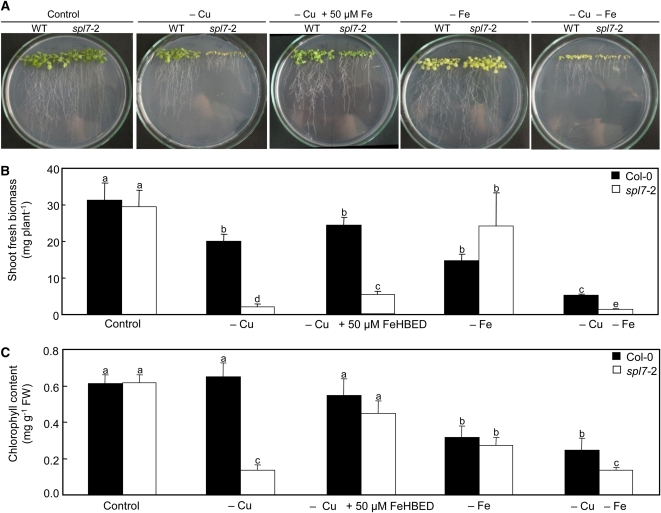
The transition metal copper (Cu) is essential for all living organisms but is toxic when present in excess. To identify Cu deficiency responses comprehensively, we conducted genome-wide sequencing-based transcript profiling of Arabidopsis thaliana wild-type plants and of a mutant defective in the gene encoding SQUAMOSA PROMOTER BINDING PROTEIN-LIKE7 (SPL7), which acts as a transcriptional regulator of Cu deficiency responses. In response to Cu deficiency, FERRIC REDUCTASE OXIDASE5 (FRO5) and FRO4 transcript levels increased strongly, in an SPL7-dependent manner. Biochemical assays and confocal imaging of a Cu-specific fluorophore showed that high-affinity root Cu uptake requires prior FRO5/FRO4-dependent Cu(II)-specific reduction to Cu(I) and SPL7 function. Plant iron (Fe) deficiency markers were activated in Cu-deficient media, in which reduced growth of the spl7 mutant was partially rescued by Fe supplementation. Cultivation in Cu-deficient media caused a defect in root-to-shoot Fe translocation, which was exacerbated in spl7 and associated with a lack of ferroxidase activity. This is consistent with a possible role for a multicopper oxidase in Arabidopsis Fe homeostasis, as previously described in yeast, humans, and green algae. These insights into root Cu uptake and the interaction between Cu and Fe homeostasis will advance plant nutrition, crop breeding, and biogeochemical research.


Figures

Figure 1.
Figure 1.
The Transcriptional Cu Deficiency Response of Arabidopsis and Its Dependence on SPL7. (A) Genes responding transcriptionally to Cu deficiency in an SPL7-dependent or independent fashion according to RNA-Seq. Bars represent the number of genes for which transcript levels were changed in response to Cu deficiency in the wild type. Arrows indicate up- or downregulation under Cu deficiency. The striped portion of the bars shows the number of genes regulated in an SPL7-dependent manner, and the remainder (black portion) the number regulated independent of SPL7. Transcript abundance was concluded to increase/decrease under Cu deficiency for a gene when arithmetic means of transcript abundances differed by a factor of at least 2 (FDR < 0.01) in 6-week-old wild-type Arabidopsis (Col-0) cultivated in Cu-deficient (–Cu) hydroponic solutions for 3 weeks when compared with control plants cultivated in modified Hoagland solution containing 0.25 μM Cu (+Cu) throughout. Furthermore, changes in transcript levels were concluded to be dependent on SPL7 if, additionally, [log2 FC (wild type –Cu versus spl7 –Cu) ≥ 0.5 log2 FC (wild type –Cu versus wild type +Cu] for log2 FC (wild type –Cu versus wild type +Cu) > 1, and [log2 FC (wild type –Cu versus spl7 –Cu) ≤ 0.5 log2 FC (wild type –Cu versus wild type +Cu)] for log2 FC (wild type –Cu versus wild type +Cu) < -1. Note that 0.1 hpm was assigned to all genes for which no hits were obtained in the respective sample. (B) Genes responding transcriptionally to Cu deficiency in an SPL7-dependent or -independent fashion in roots and shoots. Arrows indicate up- or downregulation under Cu deficiency. Ovals represent the number of genes for which transcript levels were changed in response to Cu deficiency in shoots (black) or roots (gray) according to RNA-Seq. The overlap between the ovals shows the number of genes regulated in both tissues. Data and data filtering were as described in (A). (C) Functional categories represented by the Cu deficiency–responsive genes. For each group of genes, identically colored bars indicate the fraction of genes assigned to the MapMan functional categories (BIN) specified. Shown are only those functional categories that were significantly overrepresented in at least one of the groups. Genes in each group are characterized by common regulation at the transcript level as indicated, based on RNA-Seq data (see Supplemental Data Set 1 online). Values for all expressed genes (gray) and values for genes encoding Cu metalloproteins (black) are shown for reference; 15 to 30% of genes are of unknown function. Significant enrichment of a functional category in a group of genes (P < 0.05, Fisher's exact test with Bonferroni corrections) is marked by asterisks. Data and data filtering were as described in (A). Refer to Methods and Supplemental Methods 1 online for detailed information concerning plant cultivation and timing of sample collection. TCA, tricarboxylic acid. [See online article for color version of this figure.]
Figure 2.
Figure 2.
Validation by Real-Time RT-PCR of Cu Deficiency–Responsive, SPL7-Dependent Regulation. (A) and (B) Relative transcript levels determined by real-time RT-PCR of FRO5, FRO4, YSL3, NRT2.7, LAC2, ARPN, and COX1 genes in roots (A) and shoots (B) of 6-week-old wild-type (WT; Col-0) and spl7-2 plants cultivated continuously in a hydroponic solution containing the usual concentrations of 0.25 μM CuSO4 (+Cu, control) or cultivated in a solution lacking added Cu (–Cu) for the final 3 weeks before harvest. Values are arithmetic means ± sd of n = 4 technical replicates from one experiment representative of two independent biological experiments. Data shown are transcript levels relative to EF1α as a constitutively expressed control gene, multiplied by 1000 (see Supplemental Methods 1 online). Tissues from at least five culture vessels containing two plants each were pooled for each genotype and treatment per experiment. (C) Correlation between RNA-Seq and real-time RT-PCR data. Data points representing transcript level ratios of –Cu versus control treatments are shown in black, and data points representing transcript level ratios of spl7-2 versus the wild type are shown in gray. Data are from two independent biological experiments. (D) Correlation showing between-experiment reproducibility. Data from a third independent experiment are shown as a function of the arithmetic mean of data from the two experiments analyzed by RNA-Seq. Data points represent ratios of transcript levels of –Cu versus control treatments (black) and spl7-2 versus the wild type (gray) as determined by real-time RT-PCR.
Figure 3.
Figure 3.
Root Surface Cu(II) Chelate Reductase Activity Does Not Respond to Cu Deficiency in spl7 Mutants and Depends on FRO4 and FRO5. Root surface Cu(II) chelate reductase activity of wild-type (WT; Col-0) and spl7-2 seedlings (A) and of wild-type (Col gl-1), fro4, amiR-FRO5, and amiR-FRO4FRO5 seedlings (B) grown for 3 weeks on vertical glass plates in an agarose-solidified nutrient medium containing 0.5 μM CuSO4 (+Cu, control) or no added Cu (–Cu). Values are arithmetic means ± sd of n = 3 replicate plates, from each of which 20 seedlings were pooled for analysis. Data are from one experiment representative of a total of four independent experiments. Note that basal activities in Cu-sufficient Col gl-1 seedlings are considerably higher than in Col-0 (see Yi and Guerinot, 1996). Note that data in Figures 3A and 6A are based on plant material grown in a common experiment. Different letters denote statistically significant differences (P < 0.05) between means based on ANOVA (Tukey’s HSD). FW, fresh biomass.
Figure 4.
Figure 4.
CS1 Visualization of Cu Uptake in Root Tips of Arabidopsis Seedlings. (A) to (D) Confocal fluorescence microscopy images taken at the central longitudinal plane of root tips stained with the Cu(I)-specific dye CS1 (top panels) and bright-field micrographs showing the outline of the corresponding root tips (bottom panels) for wild-type (WT; Col-0) and spl7-2 mutant seedlings ([A] and [B]) and for wild-type (Col gl-1), fro4, amiR-FRO5, and amiR-FRO4FRO5 seedlings ([C] and [D]). Seedlings cultivated on vertical agarose glass plates containing 0.5 μM CuSO4 (+Cu) or no added Cu (–Cu) for 2 weeks were directly stained with CS1 ([A] and [C]) or incubated in a solution containing 10 nM CuSO4 ([B] and [D]) for 10 min prior to staining with CS1. Photographs are shown from one root tip representative of a total of 15 root tips (see Supplemental Figures 10 to 12 online) from one experiment representative of two independent biological experiments in which seedlings of different genotypes were grown in groups of five individuals per genotype per plate. Bars = 5 μm. (E) and (F) Relative quantification of Cu(I)-based on fluorescence intensity of the Cu(I)CS1 complex in root tips of 2-week-old wild-type and spl7-2 mutant seedlings (E) and wild-type, fro4, amiR-FRO5, and amiR-FRO4FRO5 seedlings (F) without (Control) and with incubation in 10 nM CuSO4 prior to staining with CS1 (see [A] to [D] above). Values are arithmetic means ± sd of average pixel intensities over the imaged area of n = 3 replicate plates, for each of which data were averaged from five root tips, from one experiment representative of a total of two independent biological experiments. Different letters denote statistically significant differences (P < 0.05) between means based on ANOVA (Tukey’s HSD). A.U., arbitrary units.
Figure 5.
Figure 5.
Cu Content of Wild-Type and spl7 Mutant Plants. Total Cu content in shoots (A) and roots (B) of 6-week-old wild-type (WT; Col-0) and spl7 mutant plants upon continuous cultivation in a hydroponic solution containing the usual concentration of 0.25 μM CuSO4 (+Cu, control) or cultivation in a solution lacking added Cu (–Cu) for the final 3 weeks before harvest. Values are arithmetic means ± sd (n = 6 individuals for shoots, n = 3 pools from two individuals for roots). Data are shown from one experiment representative of a total of three independent experiments. Different letters denote statistically significant differences (P < 0.05) between means based on ANOVA (Tukey’s HSD).
Figure 6.
Figure 6.
Activation of Fe Deficiency Markers in Plants Cultivated under Cu-Deficient Conditions. (A) Root surface ferric chelate reductase activity of wild-type (WT; Col-0) and spl7-2 mutant seedlings grown on vertical agarose glass plates containing 0.5 μM CuSO4 (+Cu, control) or no added Cu (–Cu) for 3 weeks. Each value is the arithmetic mean ± sd of n = 3 replicate pools of 20 seedlings grown per plate from one experiment representative of four independent biological experiments. Note that data in Figures 3A and 6A are based on plant material grown in a common experiment. FW, fresh biomass. (B) and (C) Real-time RT-PCR analysis of transcript levels of FRO2 (B) and IRT1 (C) in roots of 6-week-old wild-type and spl7-2 plants grown continuously in a hydroponic solution containing 0.25 μM CuSO4 (+Cu, control) or grown in a solution lacking added Cu (–Cu) for the final 3 weeks before harvest. Values are arithmetic means ± sd of relative transcript levels normalized to EF1α, then multiplied by 1000, and were calculated from n = 4 technical replicates from one experiment representative of two independent biological experiments (see Supplemental Methods 1 online). (D) Specific activities of the haem-dependent enzyme catalase in shoots of wild-type and spl7-2 plants cultivated as described for (B) and (C) above. Values are arithmetic means ± sd of n = 3 replicate measurements from one experiment representative of two independent biological experiments. Different letters denote statistically significant differences (P < 0.05) between means based on ANOVA (Tukey’s HSD). (E) Abundance of Ferritin1 (FER1) protein in shoots of wild-type and spl7-2 Arabidopsis plants cultivated as described for (B) and (C) above. Soluble protein extracts (30 μg) were separated on a denaturing polyacrylamide gel and transferred to a polyvinylidene fluoride membrane for immunoblot analysis using an anti-FER1 antibody (top panel). Protein loading was visualized on the membrane through Ponceau Red staining prior to immunodetection. Data shown are from one experiment representative of two independent biological experiments.
Figure 7.
Figure 7.
Fe Content and Root Fe Accumulation of Wild-Type and spl7 Mutant Plants. (A) and (B) Total Fe content in shoots (A) and roots (B) of 6-week-old wild-type (WT; Col-0) and spl7 mutant plants upon continuous cultivation in a hydroponic solution containing a normal concentration of 0.25 μM CuSO4 (+Cu, control) or cultivation in a solution lacking added Cu (–Cu) for the final 3 weeks. Values are arithmetic means ± sd (n = 6 individuals for shoots, n = 3 pools from two individuals for roots). Data are shown from one experiment representative of a total of three independent experiments. Different letters denote statistically significant differences (P < 0.05) between means based on ANOVA (Tukey’s HSD). (C) Detection of Fe(III) using Perls’ stain in roots of wild-type and spl7-2 plants. Plants were cultivated as described above. Data shown are from one experiment representative of a total of three independent biological experiments. Bars = 1 mm.
Figure 8.
Figure 8.
Phenotypic Complementation of the Growth Defect of spl7-2 by High Fe Supply. Photographs (A), shoot fresh biomass (B), and leaf chlorophyll concentrations (C) of 21-d-old wild-type (WT) and spl7-2 mutant seedlings grown on vertical glass plates containing agarose-solidified nutrient medium (0.5 μM CuSO4, control) or the same medium containing no added Cu (–Cu), no added Cu and supplemented with 50 μM Fe(III)HBED (–Cu +50 μM Fe), no added Fe (–Fe), and no added Cu or Fe (–Cu –Fe), respectively. Photographs are shown from one experiment representative of two independent biological experiments. Values in (B) and (C) are arithmetic means ± sd of n = 3 replicate plates, from each of which material was pooled of three to four seedlings grown on a common plate, from one experiment representative of two independent biological experiments. Different letters denote statistically significant differences (P < 0.05) between means based on ANOVA (Tukey’s HSD). FW, fresh biomass. [See online article for color version of this figure.]
Figure 9.
Figure 9.
MCO Activities in Wild-Type and spl7-2 Mutant Plants. (A) to (C) In-gel detection of ferroxidase (A), phenoloxidase (B), and superoxide dismutase (C) activities in extracts of total soluble protein from roots of 6-week-old wild-type (WT) and spl7-2 plants grown continuously in a hydroponic solution containing 0.25 μM CuSO4 (+Cu, control) or grown in a solution lacking added Cu (–Cu) for the final 3 weeks before harvest. Thirty micrograms of protein was separated on a denaturing ([A] and [B]) or native (C) polyacrylamide gels. Data shown are from one experiment representative of two independent biological experiments. (D) Protein loading was visualized by Coomassie blue staining.

References

    1. Abdel-Ghany S.E. (2009). Contribution of plastocyanin isoforms to photosynthesis and copper homeostasis in Arabidopsis thaliana grown at different copper regimes. Planta 229: 767–779 - PubMed
    1. Abdel-Ghany S.E., Müller-Moulé P., Niyog K.K., Pilon M., Shikanai T. (2005). Two P-type ATPases are required for copper delivery in Arabidopsis thaliana chloroplasts. Plant Cell 17: 1233–1251 - PMC - PubMed
    1. Abdel-Ghany S.E., Pilon M. (2008). MicroRNA-mediated systemic down-regulation of copper protein expression in response to low copper availability in Arabidopsis. J. Biol. Chem. 283: 15932–15945 - PMC - PubMed
    1. Allen M.D., Kropat J., Tottey S., Del Campo J.A., Merchant S.S. (2007). Manganese deficiency in Chlamydomonas results in loss of photosystem II and MnSOD function, sensitivity to peroxides, and secondary phosphorus and iron deficiency. Plant Physiol. 143: 263–277 - PMC - PubMed
    1. Allison D.B., Gadbury G.L., Heo M.S., Fernández J.R., Lee C.K., Prolla T.A., Weindruch R. (2002). A mixture model approach for the analysis of microarray gene expression data. Comput. Stat. Data Anal. 39: 1–20

Publication types

MeSH terms