

Wideband acoustic transfer functions predict middle-ear effusion
- PMID: 22374909
- PMCID: PMC3432925
- DOI: 10.1002/lary.23182
Wideband acoustic transfer functions predict middle-ear effusion
Abstract
Objectives/hypothesis: Compare the accuracy of wideband acoustic transfer functions (WATFs) measured in the ear canal at ambient pressure to methods currently recommended by clinical guidelines for predicting middle-ear effusion (MEE).
Study design: Cross-sectional validating diagnostic study among young children with and without MEE to investigate the ability of WATFs to predict MEE.
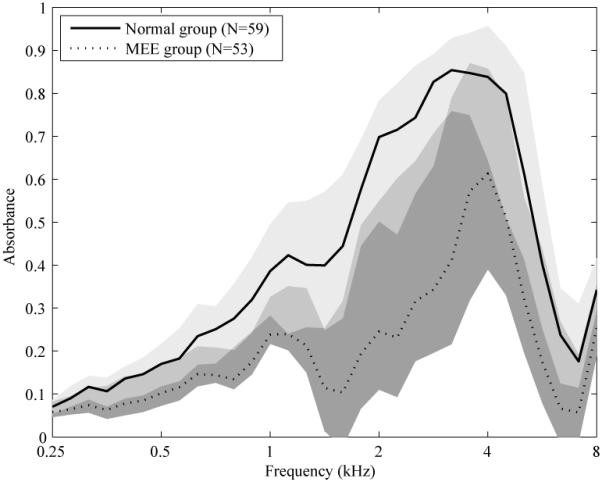
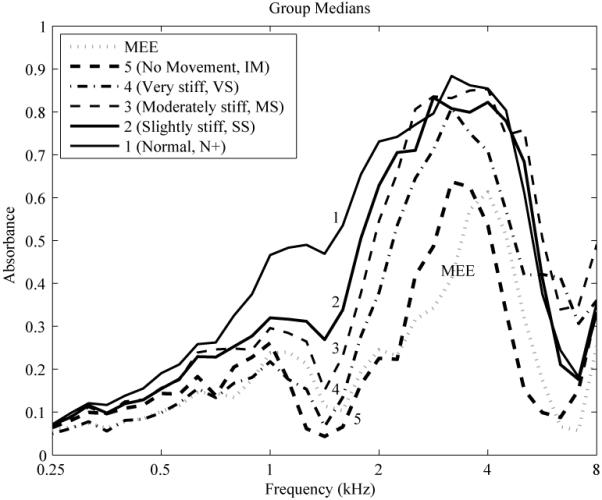
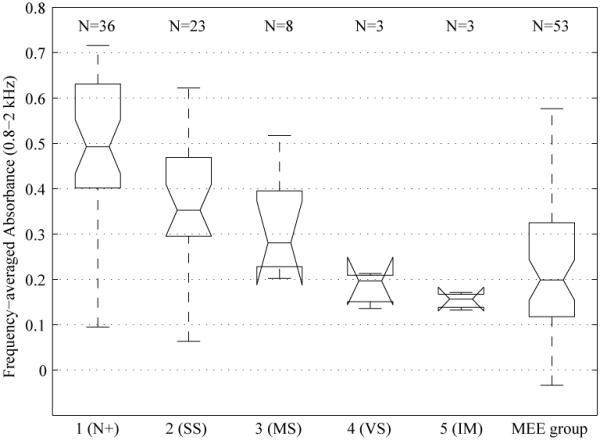
Methods: WATF measures were obtained in an MEE group of 44 children (53 ears; median age, 1.3 years) scheduled for middle-ear ventilation tube placement and a normal age-matched control group of 44 children (59 ears; median age, 1.2 years) with normal pneumatic otoscopic findings and no history of ear disease or middle-ear surgery. An otolaryngologist judged whether MEE was present or absent and rated tympanic-membrane (TM) mobility via pneumatic otoscopy. A likelihood-ratio classifier reduced WATF data (absorbance, admittance magnitude and phase) from 0.25 to 8 kHz to a single predictor of MEE status. Absorbance was compared to pneumatic otoscopy classifications of TM mobility.
Results: Absorbance was reduced in ears with MEE compared to ears from the control group. Absorbance and admittance magnitude were the best single WATF predictors of MEE, but a predictor combining absorbance, admittance magnitude, and phase was the most accurate. Absorbance varied systematically with TM mobility based on data from pneumatic otoscopy.
Conclusions: Results showed that absorbance is sensitive to middle-ear stiffness and MEE, and WATF predictions of MEE in young children are as accurate as those reported for methods recommended by the clinical guidelines.
Copyright © 2012 The American Laryngological, Rhinological, and Otological Society, Inc.
Figures
References
-
- Gelfand SA. Essentials of Audiology. 2nd ed Thieme; New York: 2001.
-
- Schappert SM. Office visits for otitis media: United States, 1975-90. Advance Data From Vital and Health Statistics of the Centers for Disease Control. 1992;214:1–18. - PubMed
-
- Tos M. Epidemiology and natural history of secretory otitis. American Journal of Otology. 1984;5:459–462. - PubMed
-
- Williamson I. Otitis media with effusion. Clinical Evidence. 2002;7:469–476. - PubMed
Publication types
MeSH terms
Grants and funding
LinkOut - more resources
Full Text Sources
