

Transcriptome analysis reveals differentially expressed transcripts in rat adrenal zona glomerulosa and zona fasciculata
- PMID: 22374966
- PMCID: PMC3320243
- DOI: 10.1210/en.2011-1915
Transcriptome analysis reveals differentially expressed transcripts in rat adrenal zona glomerulosa and zona fasciculata
Abstract
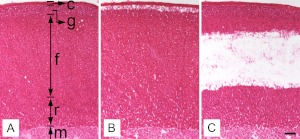
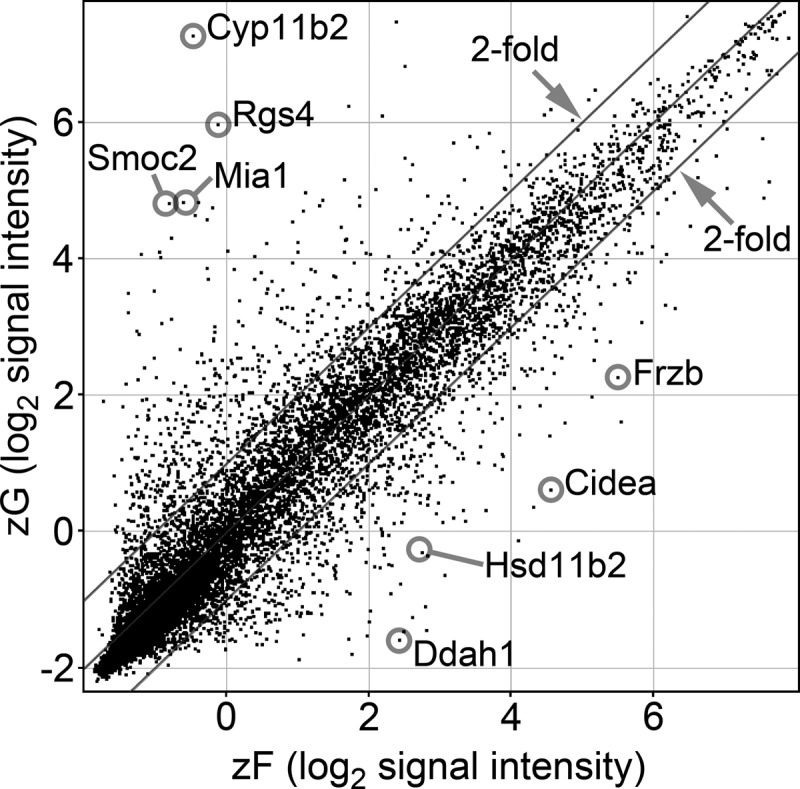
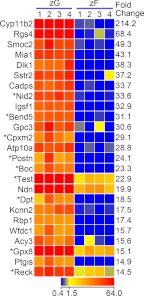
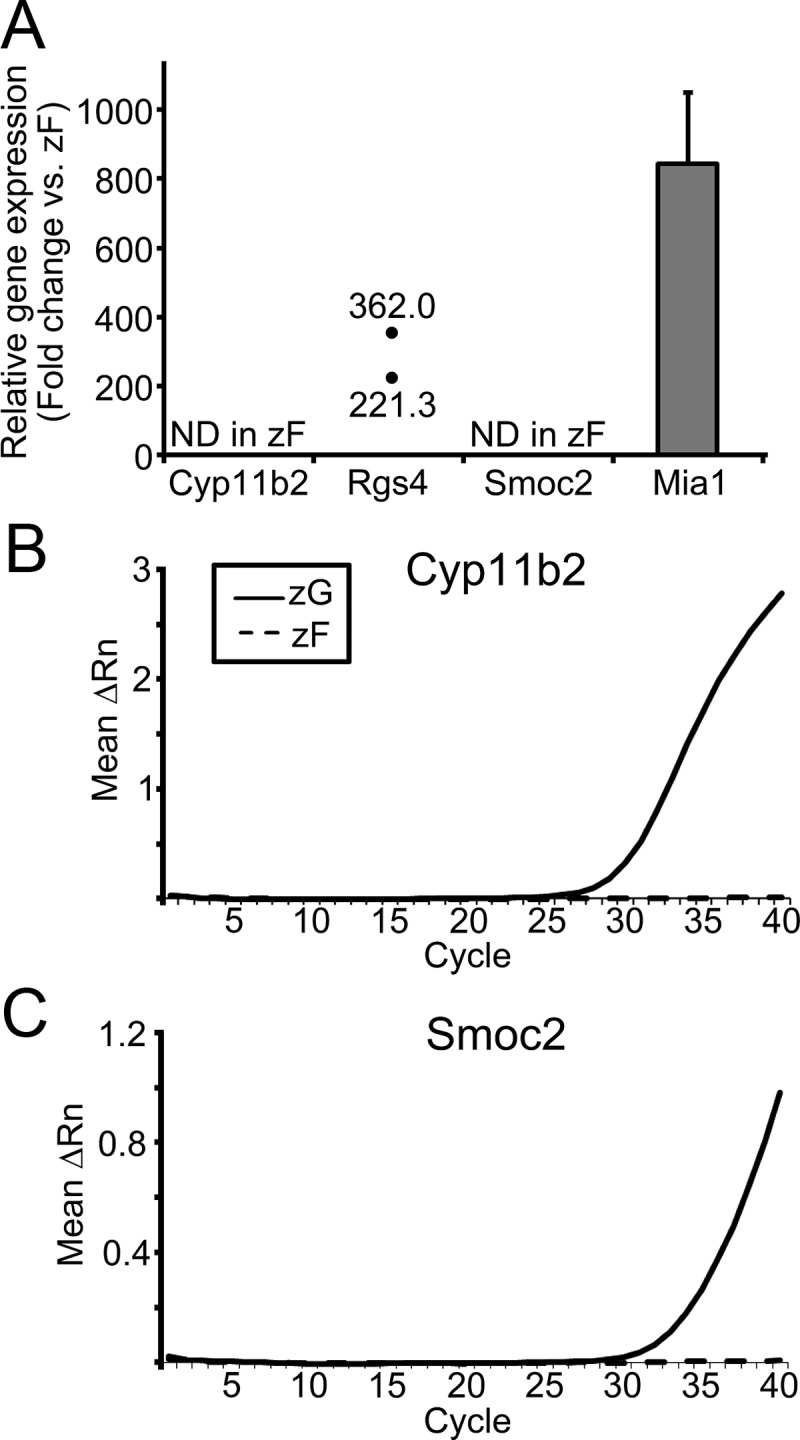
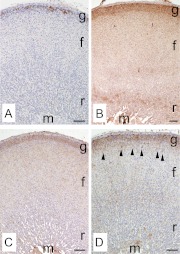
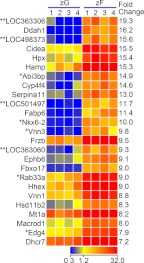
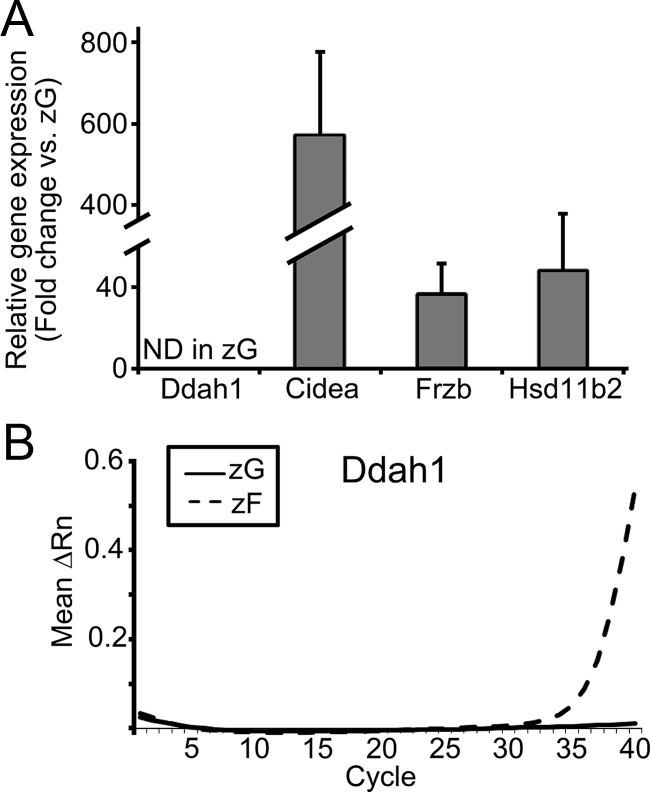
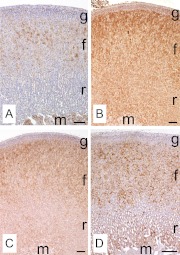
In mammals, aldosterone is produced in the zona glomerulosa (zG), the outermost layer of the adrenal cortex, whereas glucocorticoids are produced in adjacent zona fasciculata (zF). However, the cellular mechanisms controlling the zonal development and the differential hormone production (i.e. functional zonation) are poorly understood. To explore the mechanisms, we defined zone-specific transcripts in this study. Eleven-week-old male rats were used and adrenal tissues were collected from zG and zF using laser-capture microdissection. RNA was isolated, biotin labeled, amplified, and hybridized to Illumina microarray chips. The microarray data were compared by fold change calculations. In zG, 235 transcripts showed more than a 2-fold up-regulation compared to zF with statistical significance. Similarly, 231 transcripts showed up-regulation in zF. The microarray findings were validated using quantitative RT-PCR and immunohistochemical staining on selected transcripts, including Cyp11b2 (zG/zF: 214.2x), Rgs4 (68.4x), Smoc2 (49.3x), and Mia1 (43.1x) in zG as well as Ddah1 (zF/zG 16.2x), Cidea (15.5x), Frzb (9.5x), and Hsd11b2 (8.3x) in zF. The lists of transcripts obtained in the current study will be an invaluable tool for the elucidation of cellular mechanisms leading to zG and zF functional zonation.
Figures
Similar articles
-
Transcriptome profiling reveals differentially expressed transcripts between the human adrenal zona fasciculata and zona reticularis.J Clin Endocrinol Metab. 2014 Mar;99(3):E518-27. doi: 10.1210/jc.2013-3198. Epub 2013 Jan 1. J Clin Endocrinol Metab. 2014. PMID: 24423296 Free PMC article.
-
Development of adrenal cortex zonation.Endocrinol Metab Clin North Am. 2015 Jun;44(2):243-74. doi: 10.1016/j.ecl.2015.02.001. Endocrinol Metab Clin North Am. 2015. PMID: 26038200 Free PMC article. Review.
-
Epigenomic Alterations of the Human CYP11B Gene in Adrenal Zonation.Int J Mol Sci. 2024 Nov 7;25(22):11956. doi: 10.3390/ijms252211956. Int J Mol Sci. 2024. PMID: 39596027 Free PMC article.
-
Zonal expression of dickkopf-3 and components of the Wnt signalling pathways in the human adrenal cortex.J Endocrinol. 2003 Jul;178(1):149-58. doi: 10.1677/joe.0.1780149. J Endocrinol. 2003. PMID: 12844346
-
Lessons from the gene expression pattern of the rat zona glomerulosa.Mol Cell Endocrinol. 2013 May 22;371(1-2):107-13. doi: 10.1016/j.mce.2012.12.023. Epub 2012 Dec 31. Mol Cell Endocrinol. 2013. PMID: 23287491 Free PMC article. Review.
Cited by
-
Sex-related gene expression profiles in the adrenal cortex in the mature rat: microarray analysis with emphasis on genes involved in steroidogenesis.Int J Mol Med. 2015 Mar;35(3):702-14. doi: 10.3892/ijmm.2015.2064. Epub 2015 Jan 9. Int J Mol Med. 2015. PMID: 25572386 Free PMC article.
-
Dicer deficiency reveals microRNAs predicted to control gene expression in the developing adrenal cortex.Mol Endocrinol. 2013 May;27(5):754-68. doi: 10.1210/me.2012-1331. Epub 2013 Mar 21. Mol Endocrinol. 2013. PMID: 23518926 Free PMC article.
-
Update on Biology and Genomics of Adrenocortical Carcinomas: Rationale for Emerging Therapies.Endocr Rev. 2022 Nov 25;43(6):1051-1073. doi: 10.1210/endrev/bnac012. Endocr Rev. 2022. PMID: 35551369 Free PMC article.
-
Small-Conductance Ca2+-Activated Potassium Channels Negatively Regulate Aldosterone Secretion in Human Adrenocortical Cells.Hypertension. 2016 Sep;68(3):785-95. doi: 10.1161/HYPERTENSIONAHA.116.07094. Epub 2016 Jul 18. Hypertension. 2016. PMID: 27432863 Free PMC article.
-
Expression and function of Connexin 43 and Connexin 37 in the murine zona glomerulosa.Physiol Rep. 2025 Feb;13(3):e70215. doi: 10.14814/phy2.70215. Physiol Rep. 2025. PMID: 39877942 Free PMC article.
References
-
- Arnold J. 1866. Ein Beitrag zu der feiner Struktur und dem Chemismus der Nebennieren. Virchows Arch 35:64–107
-
- Vinson GP, Ho MM. 1998. Origins of zonation: the adrenocortical model of tissue development and differentiation. Clin Exp Pharmacol Physiol 25:S91–S96 - PubMed
-
- Mitani F, Mukai K, Miyamoto H, Suematsu M, Ishimura Y. 1999. Development of functional zonation in the rat adrenal cortex. Endocrinology 140:3342–3353 - PubMed
-
- Vinson GP. 2003. Adrenocortical zonation and ACTH. Microsc Res Technique 61:227–239 - PubMed
-
- Rainey WE, Carr BR, Sasano H, Suzuki T, Mason JI. 2002. Dissecting human adrenal androgen production. Trends Endocrinol Metab 13:234–239 - PubMed
Publication types
MeSH terms
Substances
Grants and funding
LinkOut - more resources
Full Text Sources
Miscellaneous
