. 2012 May;22(5):827-36.
doi: 10.1101/gr.135046.111. Epub 2012 Feb 28.

Human postmeiotic sex chromatin and its impact on sex chromosome evolution

Affiliations

Human postmeiotic sex chromatin and its impact on sex chromosome evolution

Ho-Su Sin et al. Genome Res. 2012 May.

Abstract

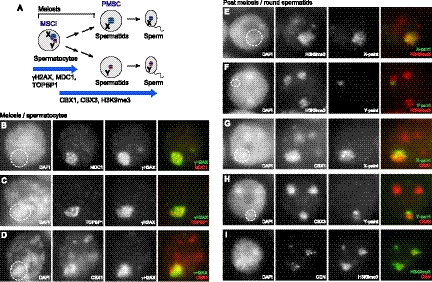
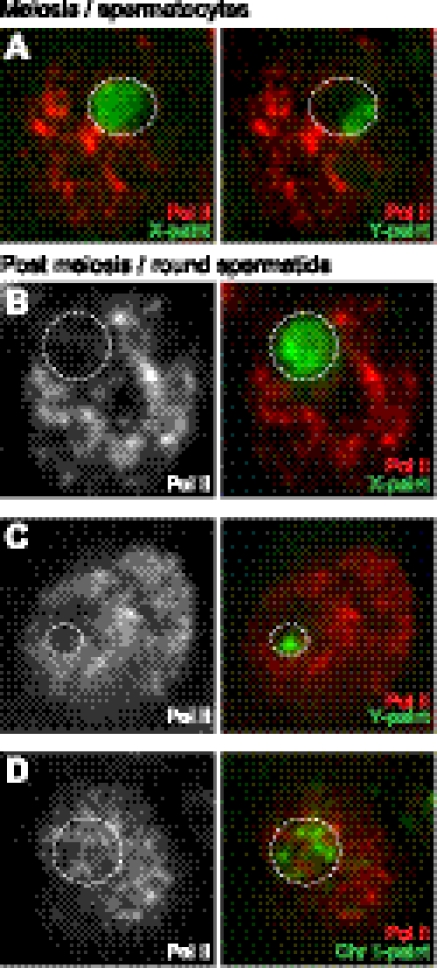
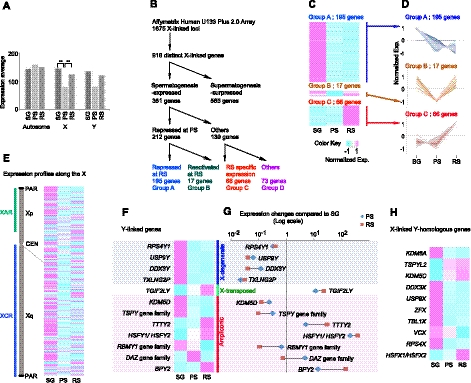
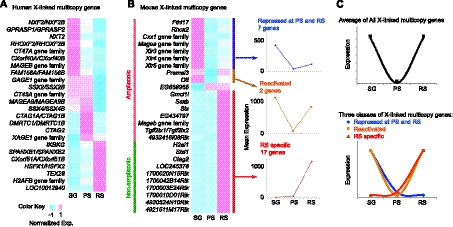
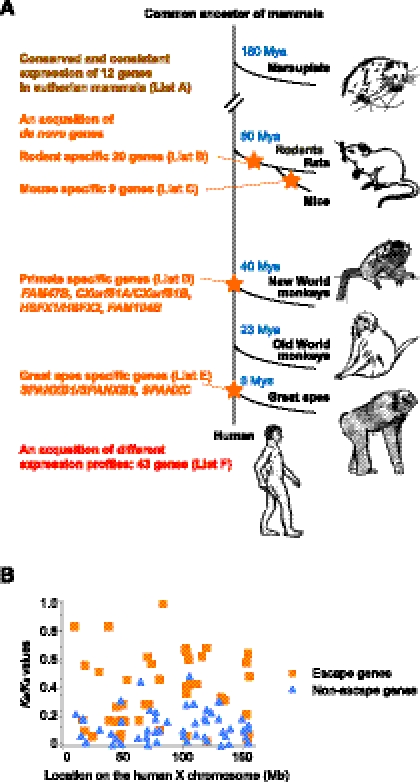
Sex chromosome inactivation is essential epigenetic programming in male germ cells. However, it remains largely unclear how epigenetic silencing of sex chromosomes impacts the evolution of the mammalian genome. Here we demonstrate that male sex chromosome inactivation is highly conserved between humans and mice and has an impact on the genetic evolution of human sex chromosomes. We show that, in humans, sex chromosome inactivation established during meiosis is maintained into spermatids with the silent compartment postmeiotic sex chromatin (PMSC). Human PMSC is illuminated with epigenetic modifications such as trimethylated lysine 9 of histone H3 and heterochromatin proteins CBX1 and CBX3, which implicate a conserved mechanism underlying the maintenance of sex chromosome inactivation in mammals. Furthermore, our analyses suggest that male sex chromosome inactivation has impacted multiple aspects of the evolutionary history of mammalian sex chromosomes: amplification of copy number, retrotranspositions, acquisition of de novo genes, and acquisition of different expression profiles. Most strikingly, profiles of escape genes from postmeiotic silencing diverge significantly between humans and mice. Escape genes exhibit higher rates of amino acid changes compared with non-escape genes, suggesting that they are beneficial for reproductive fitness and may allow mammals to cope with conserved postmeiotic silencing during the evolutionary past. Taken together, we propose that the epigenetic silencing mechanism impacts the genetic evolution of sex chromosomes and contributed to speciation and reproductive diversity in mammals.


Figures

Figure 1.
Figure 1.
Identification of human PMSC and conserved mechanisms of sex chromosome inactivation in mammalian males. (A) Schematic of sex chromosome inactivation in males, and summary of modifications on the sex chromosomes. (B–D) Identification of modifications on the XY body in human primary spermatocytes by immunostaining. Locations of the XY body are highlighted with dotted circles. (E–H) Identification of human PMSC and its modifications in human round spermatids. Immunostaining is combined with DNA FISH to detect modifications on the region of the sex chromosomes. Locations of PMSC are highlighted with dotted circles. (I) Organization of the chromocenter detected by immunostaining with anti-centromere antibody in human round spermatids. All images are wide-field images.
Figure 2.
Figure 2.
Transcriptional silencing on human PMSC. Immunostaining of RNA polymerase II (Pol II) and combined DNA FISH. (A–C) Transcriptional silencing of the human XY body and human PMSC. Locations of the XY body and PMSC are highlighted with dotted circles. (D) The chromosome territory of chromosome 1 (dotted circle) extends over the Pol II–positive regions. All images are deconvolved single Z-sections.
Figure 3.
Figure 3.
Microarray analysis of human MSCI and postmeiotic silencing. (A) Expression average of spermatogonia (SG), pachytene spermatocytes (PS), and round spermatids (RS). (**) p < 10−4, Tukey's multiple comparison test. (B) Classification of X-linked genes based on the expression profiles. (C) Expression heatmaps of normalized gene expression profiles for each group. (D) Normalized expression patterns of each group. (E) Expression heatmap along the location of the X chromosome. (F) Expression heatmap of Y-linked genes; genomic features are indicated. (G) Expression changes of Y-linked genes compared with SG. (H) Expression heatmap of X-linked Y-homologous genes.
Figure 4.
Figure 4.
Expression profiles of X-linked multicopy genes. (A) Expression heat map of human X-linked multicopy genes in this study (see Methods) (Chalmel et al. 2007; Wu et al. 2009). (B) Expression heatmap of mouse X-linked multicopy genes. Published microarray data were reanalyzed (Namekawa et al. 2006). SG in mice data sets represents the average expression levels between spermatogonia A and B. Mean expression patterns are shown in right panels. A previous study proposed that most multicopy X-linked genes are repressed by MSCI and reactivated in RS in mice (Mueller et al. 2008). However, we found that mouse multicopy X-linked genes are mainly classified into two major groups. The first group is repressed by MSCI, and these genes also stay repressed in RS (repressed at PS and RS); the other group is expressed in an RS-specific manner, and these genes are already silent in the mitotic cells, regardless of MSCI (RS-specific). We found that only two genes (Plemel3 and Ott in panel B) showed repression by MSCI and reactivation in RS in mice. (C) Of note, when we calculate the average expression of the two major groups, “Repressed at PS and RS” and “RS-specific,” our data mirror the expression pattern from the previous study (Mueller et al. 2008).
Figure 5.
Figure 5.
Autosomal X-retrotransposed genes compensate postmeiotic silencing. (A,B) Comparison of gene expression levels of X-linked parental genes (X) and X-retrotransposed genes (TG) in humans and mice, respectively. The central dot is the median, the boxes encompass 50% of the data points, and the error bars indicate 90% of data points. (*) p < 0.05; (**) p < 0.001, unpaired t-test.
Figure 6.
Figure 6.
Evolutionary impacts of postmeiotic silencing. (A) Evolutionary history of escape genes from postmeiotic silencing in the course of mammalian evolution. Genes in lists A–F are displayed in Supplemental Table S8. Stars denote the acquisition timing of de novo genes. (Mya) Million years ago. (B) Distribution of Ka/Ks values of X-linked escape genes and non-escape genes (listed in Supplemental Table S9) along the length of the X chromosome. Ka/Ks values are calculated between humans and mice.

Similar articles

Cited by

References

    1. Altschul SF, Lipman DJ 1990. Protein database searches for multiple alignments. Proc Natl Acad Sci 87: 5509–5513 - PMC - PubMed
    1. Altschul SF, Gish W, Miller W, Myers EW, Lipman DJ 1990. Basic Local Alignment Search Tool. J Mol Biol 215: 403–410 - PubMed
    1. Betran E, Thornton K, Long M 2002. Retroposed new genes out of the X in Drosophila. Genome Res 12: 1854–1859 - PMC - PubMed
    1. Carrel L, Willard HF 2005. X-inactivation profile reveals extensive variability in X-linked gene expression in females. Nature 434: 400–404 - PubMed
    1. Chalmel F, Rolland AD, Niederhauser-Wiederkehr C, Chung SS, Demougin P, Gattiker A, Moore J, Patard JJ, Wolgemuth DJ, Jegou B, et al. 2007. The conserved transcriptome in human and rodent male gametogenesis. Proc Natl Acad Sci 104: 8346–8351 - PMC - PubMed

Publication types

LinkOut - more resources