. 2012 Mar 13;109(11):4098-103.
doi: 10.1073/pnas.1200352109. Epub 2012 Feb 28.

Cellulose microfibril crystallinity is reduced by mutating C-terminal transmembrane region residues CESA1A903V and CESA3T942I of cellulose synthase

Affiliations

Cellulose microfibril crystallinity is reduced by mutating C-terminal transmembrane region residues CESA1A903V and CESA3T942I of cellulose synthase

Darby M Harris et al. Proc Natl Acad Sci U S A. .

Abstract

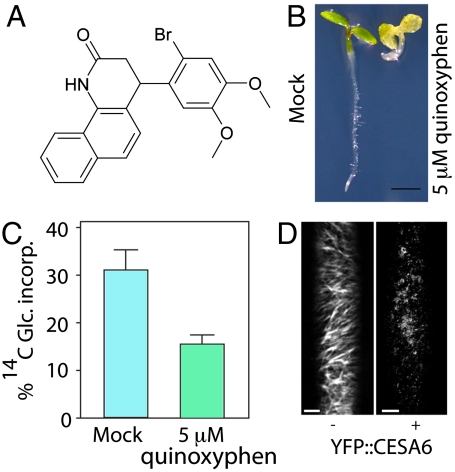
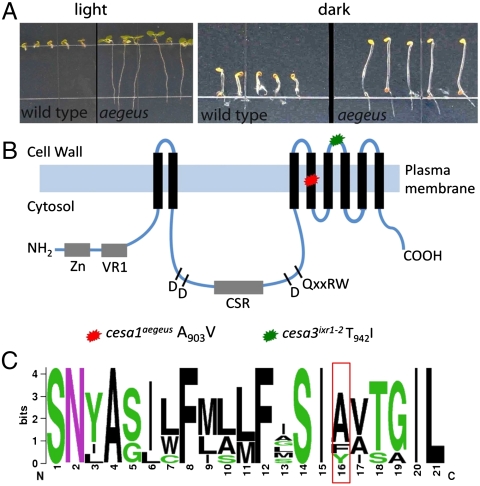
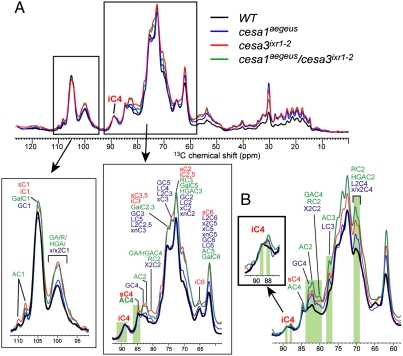
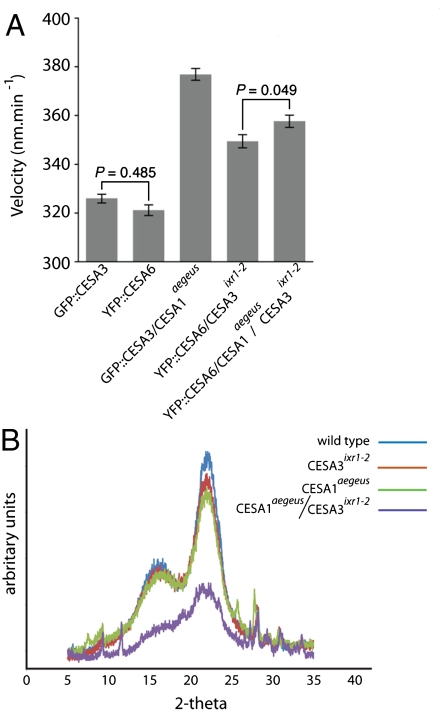
The mechanisms underlying the biosynthesis of cellulose in plants are complex and still poorly understood. A central question concerns the mechanism of microfibril structure and how this is linked to the catalytic polymerization action of cellulose synthase (CESA). Furthermore, it remains unclear whether modification of cellulose microfibril structure can be achieved genetically, which could be transformative in a bio-based economy. To explore these processes in planta, we developed a chemical genetic toolbox of pharmacological inhibitors and corresponding resistance-conferring point mutations in the C-terminal transmembrane domain region of CESA1(A903V) and CESA3(T942I) in Arabidopsis thaliana. Using (13)C solid-state nuclear magnetic resonance spectroscopy and X-ray diffraction, we show that the cellulose microfibrils displayed reduced width and an additional cellulose C4 peak indicative of a degree of crystallinity that is intermediate between the surface and interior glucans of wild type, suggesting a difference in glucan chain association during microfibril formation. Consistent with measurements of lower microfibril crystallinity, cellulose extracts from mutated CESA1(A903V) and CESA3(T942I) displayed greater saccharification efficiency than wild type. Using live-cell imaging to track fluorescently labeled CESA, we found that these mutants show increased CESA velocities in the plasma membrane, an indication of increased polymerization rate. Collectively, these data suggest that CESA1(A903V) and CESA3(T942I) have modified microfibril structure in terms of crystallinity and suggest that in plants, as in bacteria, crystallization biophysically limits polymerization.


Conflict of interest statement

The authors declare no conflict of interest.

Figures

Fig. 1.
Fig. 1.
Identification of quinoxyphen as a cellulose biosynthesis inhibitor. (A) Structure of 4-(2-bromo-4,5-dimethoxy-phenyl)-3,4-dihydro-1H-benzo-quinolin-2-one (C21H18BrNO3 MW 412.28), named herein quinoxyphen. (B) Arabidopsis seedlings grown under continuous light for 5 d on MS agar containing 5 μM quinoxyphen (Right) showed reduce growth compared with control plant (Left). Scale bar, 10 mm. (C) Incorporation of 14C-glucose in the acid-insoluble fraction in WT treated and untreated with 5.0 μM quinoxyphen. (*P < 0.001, Student’s t test, n = 3 with 200 seedling per replicate). (D) Time-lapse confocal images of YFP∷CESA6 in hypocotyl cells of 3-d-old etiolated plants were compared between mock control treatment and 20 μM quinoxyphen treatment revealing clearance of the PM CSCs after 120 min. Each image in D is an average of 60 frames taken at 5-s intervals on the same Z plane (n = 3). Scale bar, 10 μm.
Fig. 2.
Fig. 2.
The aegeus mutant is resistant to quinoxyphen. (A) The phenotype of the aegeus mutant compared to WT when grown for 7 d in the light (Left) or the dark (Right) on media containing 5 μM quinoxyphen (n = 5). (B) The gene corresponding to the aegeus mutation was cloned using a map-based approach (Fig. S3 and Table S2) and revealed an alanine to valine change at position 903 in the AtCESA1 protein (At4g3241). (C) Sequence logo assessment of residues in the fourth transmembrane domain of primary cell wall CESA proteins illustrates the location and conservation of the mutated alanine residue in CESA1 (red box). Amino acids are colored according to their chemical properties: Polar amino acids are green, basic are blue, acidic are red, and hydrophobic are black.
Fig. 3.
Fig. 3.
13C magic-angle-spinning SSNMR analysis of cellulose and cell wall structure in cesa1aegeus, cesa3ixr1-2, and cesa1aegeus/cesa3ixr1-2. (A) Quantitative 13C magic-angle-spinning SSNMR spectra of WT and mutant cell walls. The intensity ratio of interior (88.5–91.5 ppm) to surface (84–86 ppm) cellulose C4 peaks was the lowest for the double mutant. The relative amount of hemicellulose and pectin signals to interior cellulose is significantly higher in all mutants compared to WT. The spectra were measured quantitatively by 13C direct polarization using a long recycle delay of 20 s. (B) 13C direct-polarization spectra measured with a short recycle delay of 2 s, which preferentially enhances the signals of mobile polysaccharides. The hemicellulose and pectin signals and the 88-ppm less-crystalline cellulose signal are increased for the mutants relative to the WT.
Fig. 4.
Fig. 4.
CESA1aegeus and CESA3ixr1-2 mutants display increased CESA particle velocity at the PM focal plane and altered cellulose structure. (A) Epidermal cells of 3-d-old seedling expressing translational fusion reporters were imaged in the upper hypocotyl with spinning disk confocal microscopy (72 frames). CESA complex velocities from the indicated genotypes were compared using ANOVA with Bonferroni tests and significant difference indicated at P < 0.0001. Each result represents ≥720 CESA complexes from ≥10 cells from unique plants. Error bars represent SEM. The mean velocities, from left to right, were 377 ± 2.4, 349 ± 2.7, 358 ± 2.5, 326 ± 1.8, and 321 ± 2.2. (B) Analysis of cesa1aegeus, cesa3ixr1-2, and cesa1aegeus/cesa3ixr1-2 structural changes in the cellulose fingerprint compared between mutant plants and WT were initially screened by wide-angle XRD using Bragg–Brentano reflective geometries to obtain an RCI: WT = 73.1 ± 1.1, *cesA3ixr1-2 = 68.7 ± 1.4, *cesA1aegeus = 68.4 ± 2.0, *cesA1aegeus/cesA3ixr1-2 = 65.4 ± 1.8 (*P < 0.01 Student’s t test, n = 3).

References

    1. Brown R, Jr, Montezinos D. Cellulose microfibrils: Visualization of biosynthetic and orienting complexes in association with the plasma membrane. Proc Natl Acad Sci USA. 1976;73:143–147. - PMC - PubMed
    1. Tsekos I. The sites of cellulose synthesis in algae: Diversity and evolution of cellulose-synthesizing enzyme complexes. J Phycol. 1999;35:635–655.
    1. Atalla RH, VanderHart DL. Native cellulose: A composite of two distinct crystalline forms. Science. 1984;223:283–285. - PubMed
    1. Nishiyama Y, Langan P, Chanzy H. Crystal structure and hydrogen-bonding system in cellulose 1b from synchrotron X-ray and neutron fiber diffraction. J Am Chem Soc. 2002;124:9074–9082. - PubMed
    1. Nishiyama Y, Sugiyama J, Chanzy H, Langan P. Crystal structure and hydrogen bonding system in cellulose 1a from synchrotron X-ray and neutron fibre diffraction. J Am Chem Soc. 2003;125:14300–14306. - PubMed

Publication types

MeSH terms

LinkOut - more resources