. 2012 Feb 27:3:45.
doi: 10.3389/fmicb.2012.00045. eCollection 2012.

Environmental controls on nitrogen and sulfur cycles in surficial aquatic sediments

Affiliations

Environmental controls on nitrogen and sulfur cycles in surficial aquatic sediments

Chuanhui Gu et al. Front Microbiol. .

Abstract

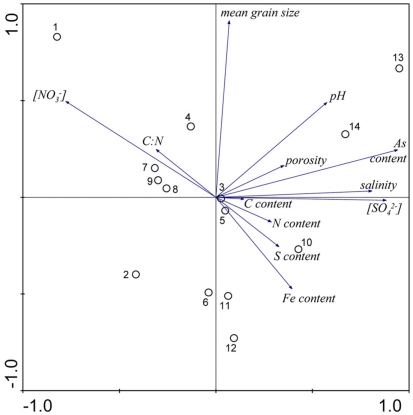
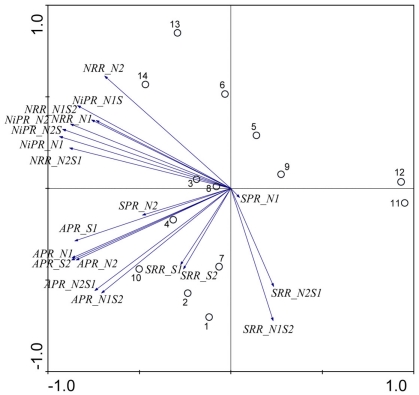
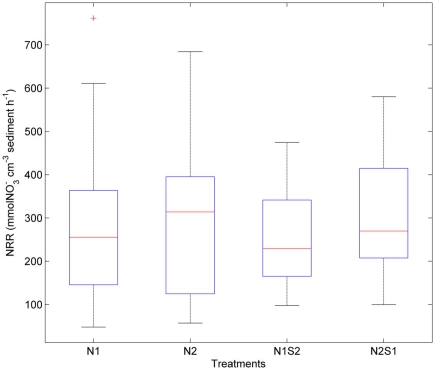
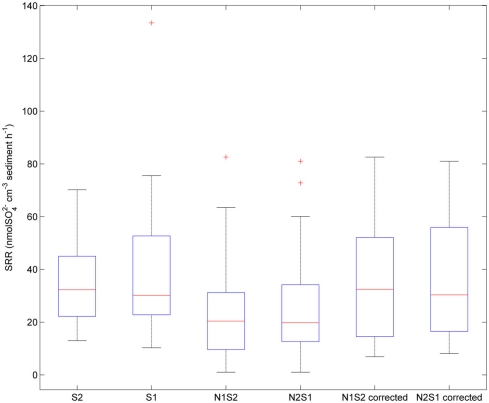
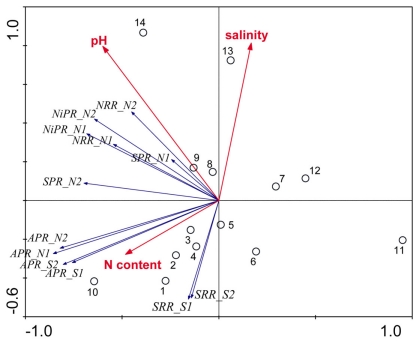
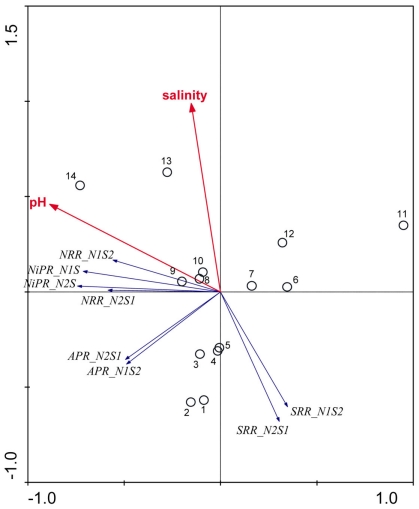
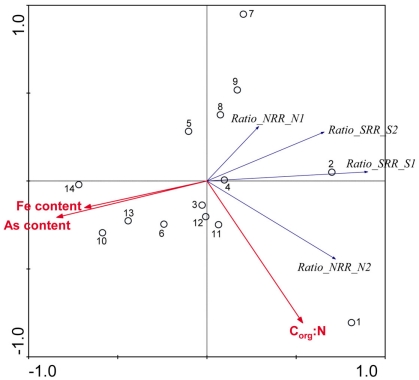
Enhanced anthropogenic inputs of nitrogen (N) and sulfur (S) have disturbed their biogeochemical cycling in aquatic and terrestrial ecosystems. The N and S cycles interact with one another through competition for labile forms of organic carbon between nitrate-reducing and sulfate-reducing bacteria. Furthermore, the N and S cycles could interact through nitrate [Formula: see text] reduction coupled to S oxidation, consuming [Formula: see text] and producing sulfate [Formula: see text] The research questions of this study were: (1) what are the environmental factors explaining variability in N and S biogeochemical reaction rates in a wide range of surficial aquatic sediments when [Formula: see text] and [Formula: see text] are present separately or simultaneously, (2) how the N and S cycles could interact through S oxidation coupled to [Formula: see text] reduction, and (3) what is the extent of sulfate reduction inhibition by nitrate, and vice versa. The N and S biogeochemical reaction rates were measured on intact surface sediment slices using flow-through reactors. The two terminal electron acceptors [Formula: see text] and [Formula: see text] were added either separately or simultaneously and [Formula: see text] and [Formula: see text] reduction rates as well as [Formula: see text] reduction linked to S oxidation were determined. We used redundancy analysis, to assess how environmental variables were related to these rates. Our analysis showed that overlying water pH and salinity were two dominant environmental factors that explain 58% of the variance in the N and S biogeochemical reaction rates when [Formula: see text] and [Formula: see text] were both present. When [Formula: see text] and [Formula: see text] were added separately, however, sediment N content in addition to pH and salinity accounted for 62% of total variance of the biogeochemical reaction rates. The [Formula: see text] addition had little effect on [Formula: see text] reduction; neither did the [Formula: see text] addition inhibit [Formula: see text] reduction. The presence of [Formula: see text] led to [Formula: see text] production most likely due to the oxidation of sulfur. Our observations suggest that metal-bound S, instead of free sulfide produced by [Formula: see text] reduction, was responsible for the S oxidation.

Keywords: aquatic sediments; denitrification; estuarine sediments; salinity; salt marsh; sulfate reduction; sulfide oxidation; wetland soils.


Figures

Figure 1
Figure 1
Principal component analysis bi-plots of the sample stations (O) and the surface water and sediment characteristics (→) along the first two principal components.
Figure 2
Figure 2
Principal component analysis bi-plots of the sample stations (O) and the potential reaction rates (→) along the first two principal components.
Figure 3
Figure 3
Box plots of nitrate reduction rates (NRR) across all sites for the nitrate only treatments (N1 if nitrate first, N2 if sulfate first) and nitrate + sulfate treatments (N1S2 if nitrate first, N2S1 if sulfate first). Boxes encompass the upper and lower quartiles, while the line indicates the median. Asterisks are outliers.
Figure 4
Figure 4
Box plot of sulfate reduction rates (SRR) across all sites for the sulfate only treatments (S1 if sulfate first, S2 if nitrate first), and sulfide oxidation uncorrected and corrected SRR for nitrate + sulfate treatments (N1S2 if nitrate first, N2S1 if sulfate first). Boxes encompass the upper and lower quartiles, while the line indicates the median. Asterisks are outliers.
Figure 5
Figure 5
Box plot of ammonium production rates (APR) across all for the nitrate only treatments (N1 of nitrate first, N2 if sulfate first), sulfate only treatments (S1 of sulfate first, S2 if nitrate first), and nitrate + sulfate treatments (N1S2 of nitrate first, N2S1 if sulfate first). Boxes encompass the upper and lower quartiles, while the line indicates the median. Asterisks are outliers.
Figure 6
Figure 6
Ordination triplots of first two axes (RDA1 and RDA2) generated from redundancy analysis using reaction rates (NRR, SRR, APR, NiPR, and SPR) measured when only one electron acceptor was added (treatments N and S). Response variables (red vectors) include the combination of response variables (NRR and SRR). Explanatory variables (blue vectors) entered into the models were selected stepwise by Monte Carlo permutation test. Site numbers are located according to their ordination sample scores. Transform: response variable via log 10 (x + 1), and explanatory variables via square root. Vectors pointing in the same direction indicate a positive correlation, vectors crossing at right angles indicate a near zero correlation, while vectors pointing in opposite direction show a high negative correlation.
Figure 7
Figure 7
Ordination triplots of first two axes (RDA1 and RDA2) generated from redundancy analysis using reaction rates (NRR, SRR, APR, and NiPR) measured when the two electron acceptors were added simultaneously (treatments NS). Response variables (red vectors) include the combination of response variables (NRR and SRR). Explanatory variables (blue vectors) entered into the models were selected stepwise by Monte Carlo permutation test. Site numbers are located according to their ordination sample scores. Transform: Response variable via log 10 (x + 1), and explanatory variables via square root.
Figure 8
Figure 8
Ordination triplots of first two axes (RDA1 and RDA2) generated from redundancy analysis using the ratio in NRR and SRR measured for separate (N or S) and simultaneous (NS) additions of nitrate and sulfate (RATIO_NRR and RATIO_SRR). Response variables (red vectors) include the combination of response variables. Explanatory variables (blue vectors) entered into the models were selected stepwise by Monte Carlo permutation test. All variables showed significant correlations with the canonical axes. Site numbers are located according to their ordination sample scores. Transform: response variable via log 10 (x + 1), and explanatory variables via square root.

References

    1. Aelion C. M., Warttinger U. (2009). Low sulfide concentrations affect nitrate transformations in freshwater and saline coastal retention pond sediments. Soil Biol. Biochem. 41, 735–74110.1016/j.soilbio.2009.01.015 - DOI
    1. Benz M., Brune A., Schink B. (1998). Anaerobic and aerobic oxidation of ferrous iron at neutral pH by chemoheterotrophic nitrate-reducing bacteria. Arch. Microbiol. 169, 159–16510.1007/s002030050555 - DOI - PubMed
    1. Blackburn T. H., Henriksen K. (1983). Nitrogen cycling in different types of sediments from danish waters. Limnol. Oceanogr. 28, 477–49310.4319/lo.1983.28.3.0477 - DOI
    1. Brettar I., Rheinheimer G. (1991). Denitrification in the central baltic – evidence for H2s-oxidation as motor of denitrification at the oxic-anoxic interface. Mar. Ecol. Prog. Ser. 77, 157–16910.3354/meps077157 - DOI
    1. Brunet R. C., GarciaGil L. J. (1996). Sulfide-induced dissimilatory nitrate reduction to ammonia in anaerobic freshwater sediments. FEMS Microbiol. Ecol. 21, 131–13810.1111/j.1574-6941.1996.tb00340.x - DOI

LinkOut - more resources