. 2012 Jun 1;21(11):2572-87.
doi: 10.1093/hmg/dds083. Epub 2012 Feb 28.

Penetrance of biallelic SMARCAL1 mutations is associated with environmental and genetic disturbances of gene expression

Affiliations

Penetrance of biallelic SMARCAL1 mutations is associated with environmental and genetic disturbances of gene expression

Alireza Baradaran-Heravi et al. Hum Mol Genet. .

Abstract

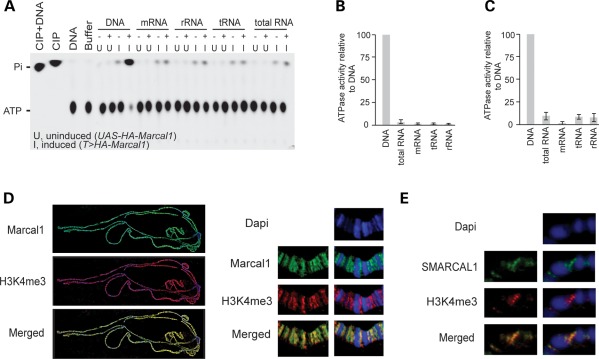
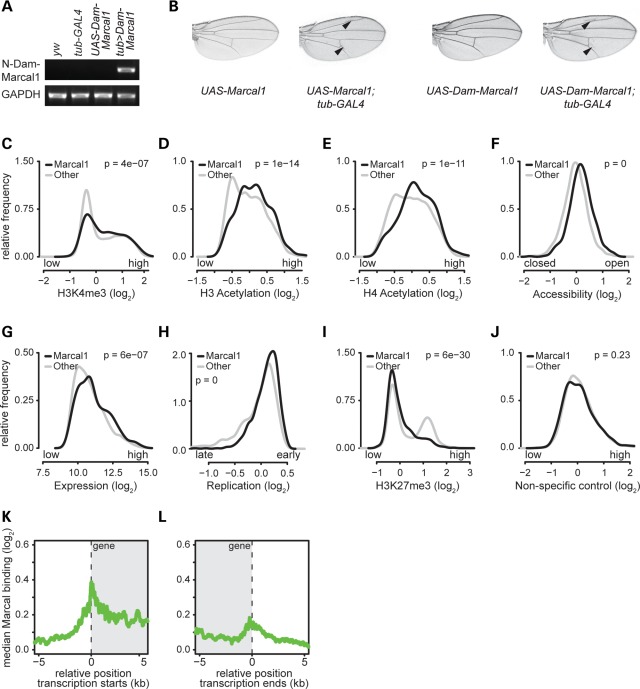
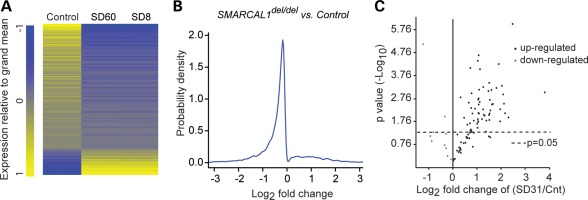
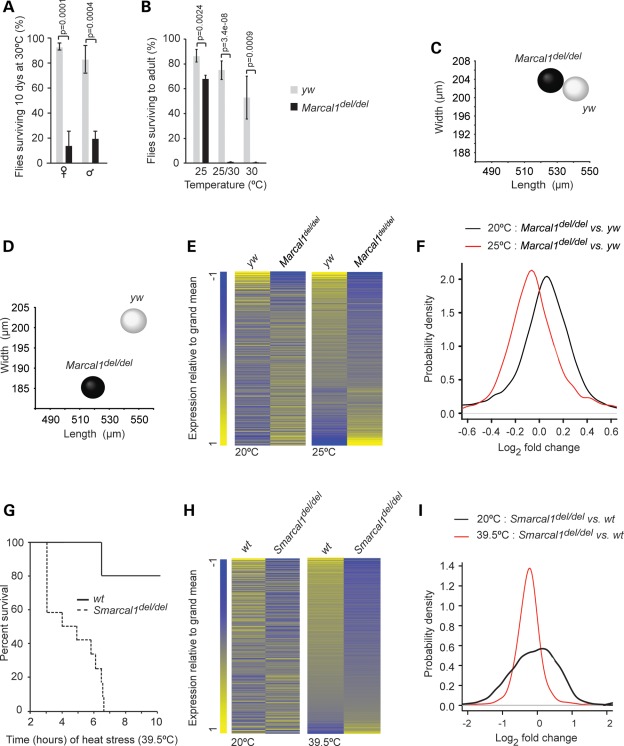
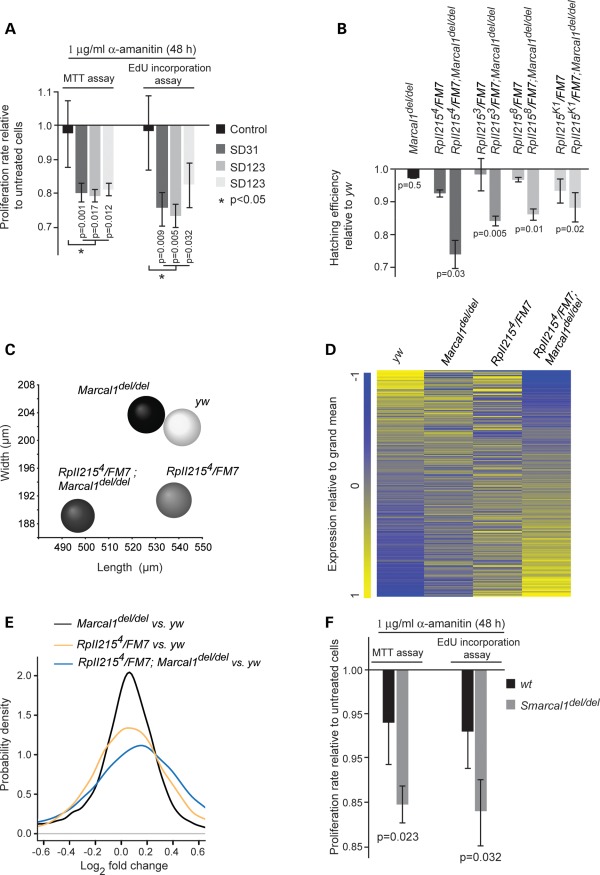
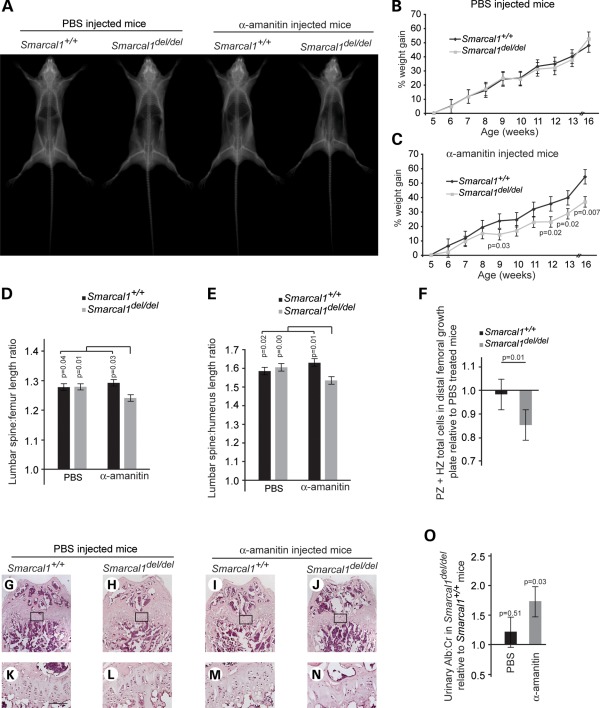
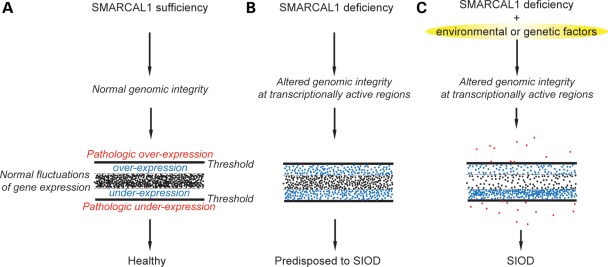
Biallelic mutations of the DNA annealing helicase SMARCAL1 (SWI/SNF-related, matrix-associated, actin-dependent regulator of chromatin, subfamily a-like 1) cause Schimke immuno-osseous dysplasia (SIOD, MIM 242900), an incompletely penetrant autosomal recessive disorder. Using human, Drosophila and mouse models, we show that the proteins encoded by SMARCAL1 orthologs localize to transcriptionally active chromatin and modulate gene expression. We also show that, as found in SIOD patients, deficiency of the SMARCAL1 orthologs alone is insufficient to cause disease in fruit flies and mice, although such deficiency causes modest diffuse alterations in gene expression. Rather, disease manifests when SMARCAL1 deficiency interacts with genetic and environmental factors that further alter gene expression. We conclude that the SMARCAL1 annealing helicase buffers fluctuations in gene expression and that alterations in gene expression contribute to the penetrance of SIOD.


Figures

Figure 1.
Figure 1.
DNA specificity and chromatin binding of Marcal1, SMARCAL1 and Smarcal1. (A) Radiograph of a thin layer chromatography plate showing that Marcal1 has DNA-dependent ATPase activity. Purified hemagglutinin (HA)-tagged Marcal1 was immunoprecipitated from transgenic flies expressing HA-tagged Marcal1 under induction (I) of the tubulin-GAL4 driver. Control immunoprecipitates were prepared in parallel from transgenic flies carrying the UAS-HA-Marcal1 transgene but not expressing it (U, uninduced). Both sets of immunoprecipitates were assayed for their ability to hydrolyze ATP to AMP and pyrophosphate (Pi) in the presence (+) or absence (−) of DNA, mRNA, rRNA, tRNA or total RNA. Calf intestinal phosphatase (CIP) was used as positive control, and the samples containing only DNA or buffer without immunoprecipitated enzyme were used as negative controls. (B and C) Plots showing the DNA-dependent ATPase activity of SMARCAL1 (B) and Smarcal1 (C) as measured by Kinase-Glo Luminescent Kinase Assay. For these assays, His-tagged SMARCAL1 and Smarcal1 were purified from HEK293 cells, using a nickel column, following the induction of expression with tetracycline. Nickel column elution fractions from uninduced cells were used as negative controls. Error bars represent 1 standard deviation. (D) Photographs showing immunofluorescence localization of HA-tagged Marcal1 on polytene chromosomes from tub-GAL4, UAS-HA-Marcal1 flies. Note that Marcal1 (green) binds the interband regions and co-localizes with trimethyl-K4-histone H3 (H3K4me3; red). (E) Photographs showing immunofluorescence localization of human SMARCAL1 on polytene chromosomes from MS1096-GAL4 and UAS-SMARCAL1 flies. Note that SMARCAL1 (green) also binds the interband regions and co-localizes with H3K4me3 (red).
Figure 2.
Figure 2.
Expression of Marcal1 tagged with Dam on its N terminus methylates adenine in genomic regions of Kc167 cells with hallmarks of active transcription. (A) Photograph of an agarose gel showing that, by RT-PCR, tub-GAL4 specifically induces expression of Dam-Marcal1 in transgenic UAS-Dam-Marcal1;tub>GAL4 flies. (B) Expression of Dam-Marcal1 in UAS-Dam-Marcal1;tub>GAL4 flies induces extra wing veins similar to those observed in UAS-Marcal1;tub>GAL4 flies. (C–J) Density distribution plots showing relative frequencies (y-axes) of adenine methylation (Dam-Marcal1 target regions, black) and absence of adenine methylation (non-target regions, gray) for the indicated log2-transformed features: (C) trimethylation levels of lysine 4 of histone H3 (H3K4me3, a mark of actively transcribed chromatin), (D) acetylation levels of histone H3 (a mark of actively transcribed chromatin), (E) acetylation levels of histone H4 (a mark of actively transcribed chromatin), (F) chromatin accessibility (open and closed chromatin), (G) mRNA expression levels, (H) DNA replication timing, (I) trimethylation levels of lysine 27 of histone H3 (H3K27me3, a mark of non-transcribed genes) and (J) a non-specific antibody control (rabbit anti-IgG). The log2-transformed features were obtained from previously published genome-wide data (,–84). All P-values were calculated using the Mann–Whitney U test. (K and L) Alignment plots showing the log2-transformed median adenine methylation level (y-axes) relative to transcription start sites (K) and termination sites (L) of all target genes. The gray shading indicates the transcribed region. Transcription start and termination sites are at position 0 (dashed vertical lines). Note that Dam-Marcal1 preferentially targeted transcriptional start and termination sites.
Figure 3.
Figure 3.
SMARCAL1 deficiency alters gene expression. (A) Heat map of the log2 fold differences in RNA levels (q-value <0.05) between control and SIOD patient (SD8 and SD60) skin fibroblasts. The RNA levels were measured using Affymetrix Human Genome U133 Plus 2.0 arrays and are the average of three biologic replicates. (B) Density plot showing the distribution of the log2 fold differences in RNA levels (q-value <0.05) between control and SIOD fibroblasts. (C) Volcano plot comparing the expression of stress genes in control and SIOD (SD31) skin fibroblast cell lines after 1 h incubation at 43°C followed by 1 h incubation at 37°C. The plot is derived from three biologic replicates.
Figure 4.
Figure 4.
Marcal1 and Smarcal1 deficiencies increase susceptibility to heat stress. (A) Graph of the percent of yw control and Marcal1del/del flies surviving after 10 days at 30°C. Error bars represent 1 standard deviation. (B) Graph of the percent of yw control and Marcal1del/del embryos surviving through eclosion when raised at 25°C, when raised at 25°C for the first 5 days and then switched to 30°C or when raised at 30°C. Error bars represent 1 standard deviation. (C and D) Distribution plots of the dimensions of yw and Marcal1del/del eggs laid at 20°C (C) or at 25°C (D). (E) Heat maps of the log2 fold differences in all expressed mRNAs between yw and Marcal1del/del ovaries at 20°C and at 25°C. The RNA levels were measured using Affymetrix Drosophila Genome 2.0 Array and are the average of three biologic replicates. (F) Density plots showing the distribution of the log2 fold differences in gene expression between yw and Marcal1del/del ovaries at 20 and 25°C. (G) Survival curve for Smarcal1+/+ (n = 5) and Smarcal1del/del (n = 12) mice maintained for 10 h at 39.5°C. (H) Heat map of the log2 fold differences for all expressed RNAs between Smarcal1+/+ and Smarcal1del/del livers at 20 and 39.5°C. The RNA levels were derived from transcriptome sequencing and are the average of three biologic replicates. (I) Density plots showing the distribution of the log2 fold differences in RNA levels between Smarcal1+/+ and Smarcal1del/del livers at 20 and 39.5°C.
Figure 5.
Figure 5.
Inhibition of RpII function causes penetrance of SMARCAL1, Marcal1 and Smarcal1 deficiency. (A) Graph showing the proliferation of α-amanitin-treated control and SMARCAL1del/del skin fibroblasts relative to untreated cells. The fibroblast cultures were treated with α-amanitin (1 μg/ml) for 48 h and proliferation was measured by the MTT and Click-iT EdU assays. (B) Graph showing the hatching rate at 20°C for Marcal1del/del, RpII2153 or 4 or 8 or K1/FM7 and RpII2153 or 4 or 8 or K1/FM7;Marcal1del/del embryos relative to the hatching rate of yw embryos. FM7 is an X chromosome balancer. (C) Distribution plot of egg dimensions showing that RpII2154/FM7;Marcal1del/del flies lay smaller eggs than yw, Marcal1del/del and RpII2154/FM7 flies. (D) Heat map comparing the log2 fold differences in all expressed mRNAs among yw, Marcal1del/del, RpII2154/FM7 and RpII2154/FM7;Marcal1del/del ovaries at 20°C. The RNA levels were measured using Affymetrix Drosophila Genome 2.0 Array and are the average of three biologic replicates. (E) Density plots showing the distribution of the log2 fold differences for transcripts depicted in (D). (F) Graph showing the proliferation of α-amanitin-treated Smarcal1+/+ and Smarcal1del/del MEFs relative to untreated MEFs. The MEFs were treated with α-amanitin (1 μg/ml) for 48 h and proliferation was measured by the MTT and Click-iT EdU assays. Error bars in (A), (B) and (F) represent 1 standard deviation.
Figure 6.
Figure 6.
Treatment of Smarcal1del/del mice with α-amanitin partially recapitulates SIOD. (A) Radiographs of representative male mice after 12 weeks of daily intra-peritoneal (IP) injections with PBS or 0.1 mg/kg α-amanitin. (B) Growth curve showing that Smarcal1+/+ (n = 7) and Smarcal1del/del (n = 9) mice gain weight equally when given daily IP injections of PBS. (C) Growth curve showing that Smarcal1del/del (n = 9) mice gain less weight than Smarcal1+/+ (n = 7) mice when given daily ip-injections of 0.1 mg/kg α-amanitin. (D and E) Graphs showing the ratio of lumbar spine (L1–L6) length to femur length (D) or humerus length (E) for α-amanitin- and PBS-treated mice. Note that the α-amanitin treatment disproportionately shortened the lumbar spine of the Smarcal1del/del mice. (F) Plot of fold change in chondrocyte number in the proliferative (PZ) and hypertrophic (HZ) zones in the distal femoral growth plate of α-amanitin-treated mice, Smarcal1del/del (n = 7) and Smarcal1+/+ (n = 7), relative to PBS-treated mice, Smarcal1del/del (n = 7) and Smarcal1+/+ (n = 6). (G–N) Photographs of representative H&E staining of the distal femoral growth plate of Smarcal1+/+ and Smarcal1del/del male mice treated with PBS or α-amanitin for 12 weeks. (K)–(N) Higher magnifications of the boxed areas on (G)–(J), respectively. Note the hypocellular growth plate and poorly organized columns of chondrocytes in the growth plate of the α-amanitin-treated Smarcal1del/del mouse. Bar = 100 μm. (O) Graph showing urine albumin excretion by Smarcal1del/del mice relative to Smarcal1+/+ mice, following PBS or α-amanitin treatment. Bars in (B)–(F) and (O) represent standard errors.
Figure 7.
Figure 7.
Model depicting the contribution of thresholded variations in gene expression to the penetrance of SIOD. (A) SMARCAL1 orthologs buffer random fluctuations in gene expression by modulating DNA helicity within the promoter and across transcribed regions. (B) Deficiency of the SMARCAL1 orthologs impairs maintenance of DNA structure within the transcriptionally active regions, and thereby alters gene expression. These alterations in gene expression are within a threshold of tolerance and compensated for such that few or no phenotypic features are apparent in humans and model organisms. (C) However, when transcription is further compromised by environmental or genetic factors that cause gene expression to pass a threshold, the organism is unable to compensate and manifests a phenotype.

References

    1. Romaschoff D.D. Über die Variabilität in der Manifestierung eines erblichen Merkmales (Abdomen abnormalis) bei Drosophila funebris F. J. Psychol. Neurol. 1925;31:323–325.
    1. Timoféeff-Ressovsky N.W. Über den Einfluss des Genotypus auf das phänotypen Auftreten eines einzelnes Gens. J. Psychol. Neurol. 1925;31:305–310.
    1. Vogt O. Psychiatrisch wichtige Tatsachen der zoologisch-botanischen Systematik. Zeitschrift für die gesamte. Neurol. Psychiatr. (Bucur) 1926;101:805–832.
    1. Zlotogora J. Penetrance and expressivity in the molecular age. Genet. Med. 2003;5:347–352. - PubMed
    1. Kurnit D.M., Layton W.M., Matthysse S. Genetics, chance, and morphogenesis. Am. J. Hum. Genet. 1987;41:979–995. - PMC - PubMed

Publication types

MeSH terms

Supplementary concepts