. 2012 Jun;107(11):3008-19.
doi: 10.1152/jn.00660.2011. Epub 2012 Feb 29.

Diverse levels of an inwardly rectifying potassium conductance generate heterogeneous neuronal behavior in a population of dorsal cochlear nucleus pyramidal neurons

Affiliations

Diverse levels of an inwardly rectifying potassium conductance generate heterogeneous neuronal behavior in a population of dorsal cochlear nucleus pyramidal neurons

Ricardo M Leao et al. J Neurophysiol. 2012 Jun.

Abstract

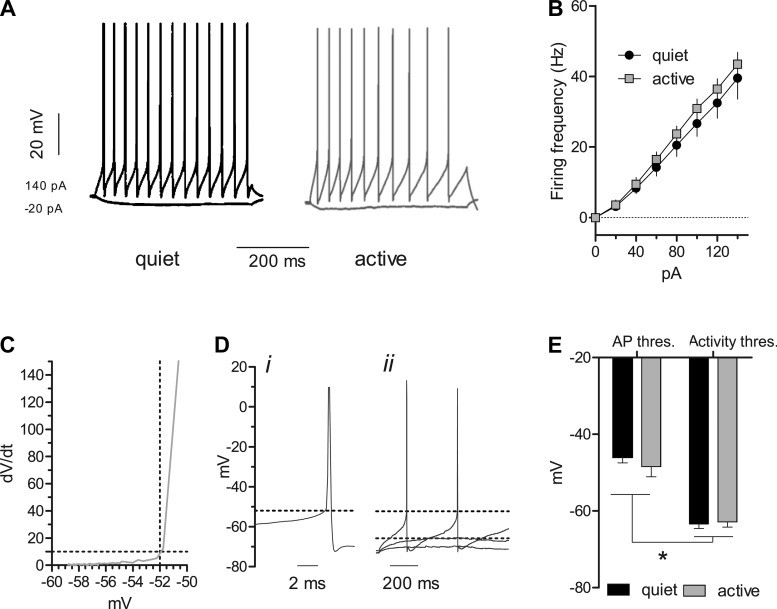
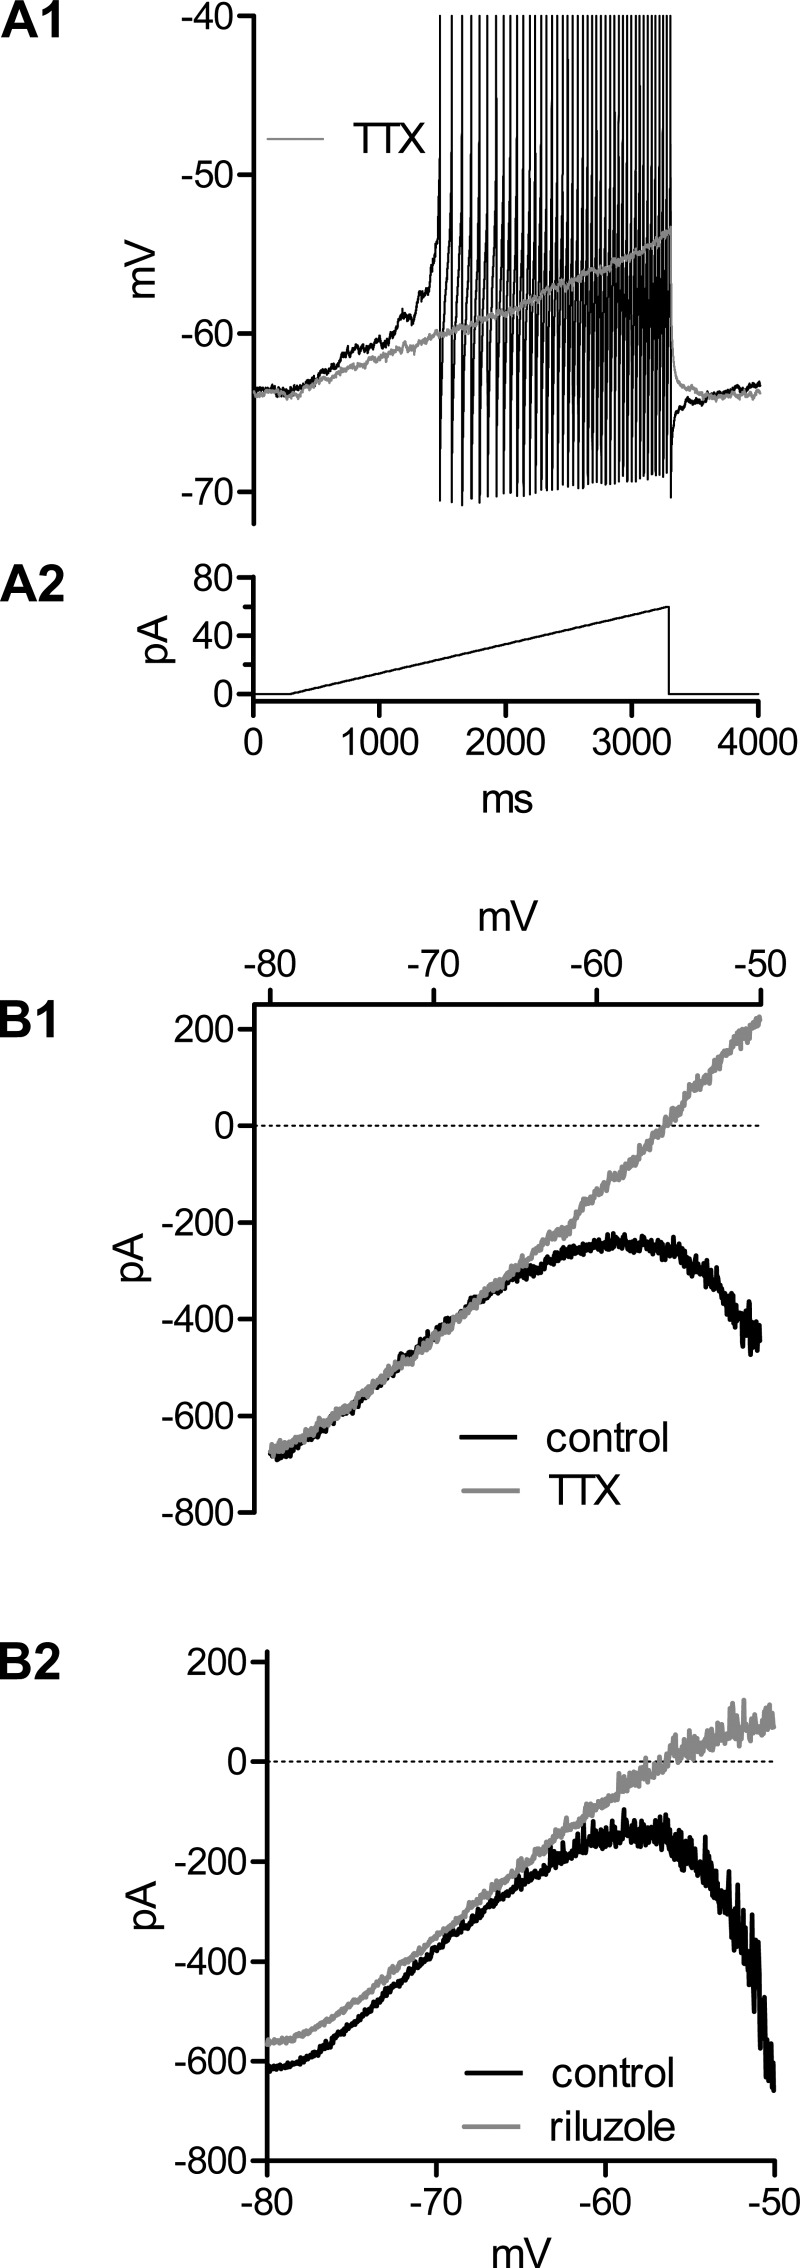
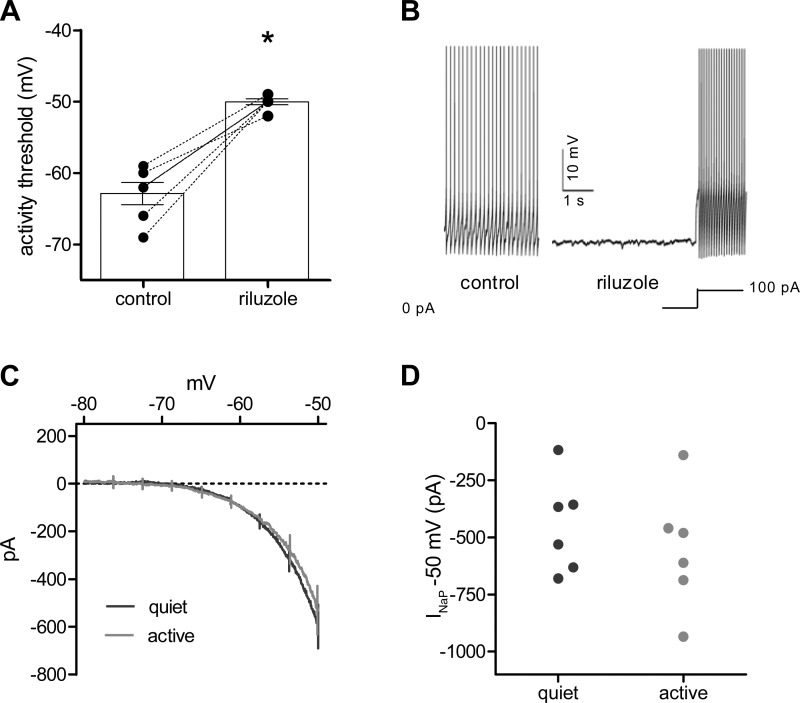
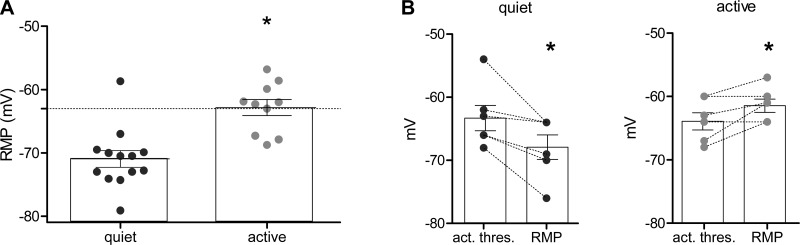
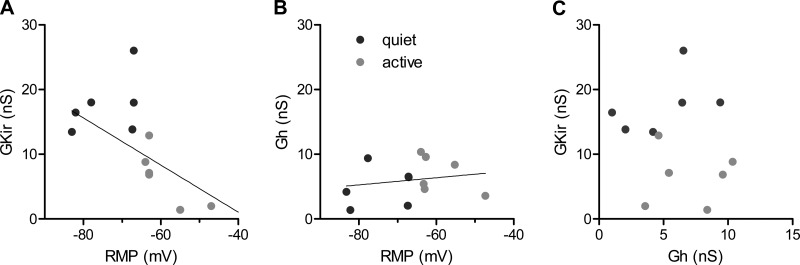
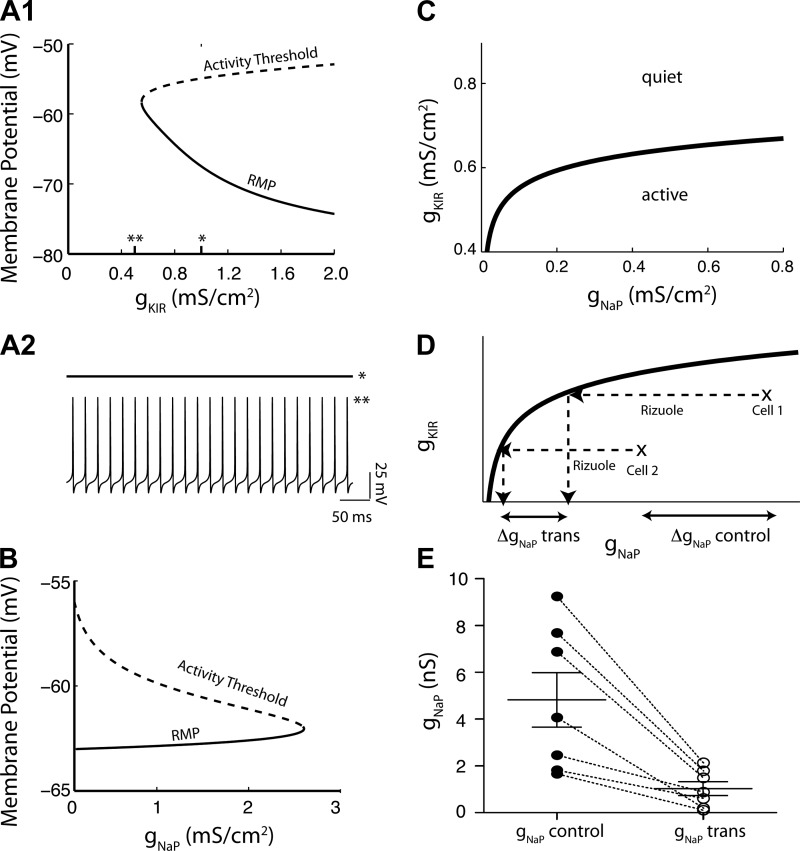
Homeostatic mechanisms maintain homogeneous neuronal behavior among neurons that exhibit substantial variability in the expression levels of their ionic conductances. In contrast, the mechanisms, which generate heterogeneous neuronal behavior across a neuronal population, remain poorly understood. We addressed this problem in the dorsal cochlear nucleus, where principal neurons exist in two qualitatively distinct states: spontaneously active or not spontaneously active. Our studies reveal that distinct activity states are generated by the differential levels of a Ba(2+)-sensitive, inwardly rectifying potassium conductance (K(ir)). Variability in K(ir) maximal conductance causes variations in the resting membrane potential (RMP). Low K(ir) conductance depolarizes RMP to voltages above the threshold for activating subthreshold-persistent sodium channels (Na(p)). Once Na(p) channels are activated, the RMP becomes unstable, and spontaneous firing is triggered. Our results provide a biophysical mechanism for generating neural heterogeneity, which may play a role in the encoding of sensory information.


Figures

Fig. 1.
Fig. 1.
Heterogeneous neuronal behavior of fusiform cells. A: histogram of the distribution of spontaneous firing rates of dorsal cochlear nucleus principal neurons (n = 45). Not spontaneously active (quiet) neurons are represented by the black bar and spontaneously active (active) neurons by gray bars. Bin size = 1 Hz. B: cumulative histogram of distribution of spontaneous firing rates of fusiform cells in control (solid trace) and in the presence (dashed trace) of inhibitory and excitatory receptor antagonists {SR95531 (SR): GABA receptor antagonist, 20 μM; strychnine (STR): glycine receptor antagonist, 0.5 μM; 2,3-dihydroxy-6-nitro-7-sulfamoyl-benzo[f]quinoxaline-2,3-dione (NBQX): α-amino-3-hydroxy-5-methyl-4-isoxazolepropionic acid receptor antagonist, 10 μM; d,l-amino-5-phosphonovaleric acid (AP5): N-methyl-d-aspartate receptor antagonist, 50 μM; n = 45 for control, and n = 62 for SR/STR/NBQX/AP5}. C: histogram of the distribution of spontaneous firing rates of fusiform cells recorded in cell-attached mode (n = 17). Quiet neurons are represented by the black bar and active neurons by gray bars. Bin size = 1 Hz. D: spontaneous firing of the same fusiform cell in cell-attached (cell attach.) and in whole-cell (w.cell) recording mode (quiet: cell attached = 0.02 ± 0.02 Hz, whole-cell = 0 ± 0.01 Hz, n = 3; active: cell attached = 3.1 ± 0.7 Hz, whole-cell = 2.2 ± 0.4 Hz, n = 3).
Fig. 2.
Fig. 2.
Active and quiet fusiform cells display similar excitability. A: representative examples of membrane potential response of quiet and active fusiform cells to hyperpolarizing (−20 pA) and depolarizing (140 pA) current injection. Active neurons for all panels of this figure were “silenced” by injection of hyperpolarizing current. B: average frequency-intensity (f-I) relationship of quiet and silenced fusiform cells. The f-I slopes are not significantly different between quiet and active neurons (quiet: n = 11, slope = 0.29 ± 0.02 Hz/pA; active: n = 11, slope = 0.32 ± 0.02 Hz/pA; P = 0.35). C: phase plane plot [first derivative of the membrane potential (dV/dt)] around the AP threshold. The sudden increase of dV/dt above 10 V/s (horizontal, dashed line) signals the AP threshold (vertical, dashed line). D: the same AP used to produce the plot in C in an expanded (i) and compressed (ii) time scale. i: the horizontal, dashed line represents the AP threshold measured in C. ii: application of small, depolarizing steps (20 and 40 pA) reveals the membrane potential, above which fusiform cells start producing spontaneous firing (activity threshold: lower, dashed, horizontal line). E: activity threshold is more hyperpolarized than AP threshold. Summary of the AP threshold (thres.) and activity threshold [AP threshold: quiet = −45.0 ± 1.5 mV, active = −48.4 ± 2.6 mV, P > 0.05, unpaired t-test; activity threshold: quiet = −63.4 ± 1 mV, active = −62.8 ± 1 mV, *P > 0.05, unpaired t-test; n = 7 for each group].
Fig. 3.
Fig. 3.
Subthreshold-persistent sodium channels are expressed in fusiform cells and drive active fusiform cells to spiking threshold. A1: response of a fusiform cell to a 3-s ramp of depolarizing current at a rate of 20 pA/100 ms (A2), before (black trace) and after (gray trace) application of TTX (1 μM). Note that subthreshold oscillations are blocked by TTX. B: current in response to a 4-s ramp from −80 to −50 mV, before (black) and after (gray) application of TTX (B1) or riluzole (10 μM; B2).
Fig. 4.
Fig. 4.
Subthreshold-persistent sodium channels are required for heterogeneous neuronal behavior, yet their variability is not correlated with distinct activity states. A: comparison of activity thresholds before and after application of riluzole (2.5 − 10 μM; activity threshold: control = −63.0 ± 1.5 mV; riluzole = −50.2 ± 0.4 mV; *P < 0.05, paired t-test). B: application of riluzole blocks spontaneous firing of active neurons without blocking current-evoked APs (n = 12). C: average TTX-sensitive current (INaP) in response to a 4-s ramp from −80 to −50 mV for quiet and active neurons (n = 5). D: INaP amplitude at −50 mV (INaP @ −50 mV) for quite and active neurons. INaP mean amplitude is not different between quiet and active neurons (quiet: 446 ± 85 pA, n = 6; active: 552 ± 108 pA, n = 6). In addition, the INaP variances in quiet and active neurons are equal (Levene's test, P = 0.7530).
Fig. 5.
Fig. 5.
Active fusiform cells display more depolarized resting membrane potential (RMP) than quiet fusiform cells. A: RMP (in the presence of TTX) of quiet and active neurons. Bars represent the average RMP value of quiet and active fusiform cells (quiet: −70.9 ± 1.3 mV, n = 13; active: −62.8 ± 1.3 mV, n = 10; *P = 0.0003, unpaired t-test). Horizontal dashed line represents the mean activity threshold. B: comparison of the RMP and activity threshold (act. thres.) of quiet (left; black circles) and active (right; gray circles) neurons (quiet: activity threshold = −63.2 ± 2 mV, RMP = −67.8 ± 2 mV, n = 6, *P = 0.025; active: activity threshold = −63.7 ± 1.4 mV, RMP = −61.2 ± 1 mV, n = 6, *P = 0.04).
Fig. 6.
Fig. 6.
Differential levels of inwardly rectifying potassium (Kir) currents among fusiform cells generates differential RMPs and thus produces quiet and active fusiform cells. A: representative traces of BaCl2-senstive currents (IKir), obtained by subtraction of the current before and after application of BaCl2 (200 μM). i: currents produced by hyperpolarization of fusiform cells; ii: BaCl2 [Ba2+ (Ba++)]-senstive currents; iii: voltage protocol. B: current-voltage plot of IKir from quiet (black circles) and active (gray circles) neurons (Kir amplitude at −65 mV: quiet = 156 ± 18 pA, n = 18; active = 82 ± 13 pA, n = 20; P < 0.05, unpaired t-test; Kir amplitude at −120 mV: quiet = −698.1 ± 79 pA, n = 18; active = −397.4 ± 67 pA, n = 20; P < 0.05, unpaired t-test). C: effect of 200 μM BaCl2 on RMP, measured in the presence of TTX in quiet (black circles) and active (gray circles) neurons (quiet: RMP in BaCl2 = −56.1 ± 1.5 mV, n = 11; active: RMP in BaCl2 = −54.0 ± 1.1 mV, n = 15; P = 0.27). D: comparison of the Ba2+-sensitive current (50 μM, open circles; 200 μM, solid circles) in quiet (black circles) and active (gray circles) neurons. Ba2+-sensitive currents (measured at −120 mV) are equally larger in quiet neurons for either 50 or 200 μM Ba2+ (Ba2+ 50 μM active: −342 ± 133 pA; Ba2+ 50 μM quiet: −810 ± 127 pA Ba2+, 136 ± 37% increase; Ba2+ 200 μM active: −433 ± 142 pA; Ba2+ 200 μM quiet: −937 ± 144 pA, 116 ± 33% increase; n = 5). The rectification index (RI) of Ba2+-sensitive currents was similar for both Ba2+ concentrations (RI active 50 μM: 0.27 ± 0.11; active 200 μM: 0.16 ± 0.02; quiet 50 μM: 0.14 ± 0.006; quiet 200 μM: 0.16 ± 0.03; P = 0.4, one-way ANOVA). E: effect of Ba2+ 50 μM (open circles) and 200 μM (solid circles) in the RMP of quiet and active neurons (quiet, RMP in 50 μM Ba2+: −53.9 ± 2.3 mV; RMP in 200 μM Ba2+: −52.5 ± 2 mV, n = 6; active, RMP in 50 μM Ba2+: −54.4 ± 1.6 mV; RMP in 200 μM Ba2+: −54 ± 1.6 mV, n = 7; P = 0.9, one-way ANOVA). F: comparison of the tertiapin-Q-sensitive current (60 nM, open symbols) and Ba2+ 200 μM (solid symbols) in quiet (n = 3) and active (n = 3) neurons. Tertiapin-Q did not affect the hyperpolarization-activated current (P = 0.86; n = 6). G: effect of tertiapin-Q (60 nM) on RMP, measured in the presence of TTX in quiet and active neurons (quiet: control = −62.5 ± 1 mV, tertiapin = −61 ± 2 mV; active: control = −57.3 ± 2 mV, tertiapin = −57.3 ± 2 mV; n = 3 each).
Fig. 7.
Fig. 7.
BaCl2-sensitive conductance (GKir) values correlate with RMP values for different fusiform cells (A). Relationship of gKir variability and RMP measured in quiet (black circles) and active (gray circles) neurons. gKir is correlated with RMP (r2 = 0.45; P = 0.017). B: relationship of ZD7288-sensitive conductance (Gh) variability and RMP measured in quiet (black circles) and active (gray circles) neurons. Gh is not correlated with RMP (r2 = 0.004; P = 0.55). C: variability of gKir and Gh obtained from the same 6 quiet (black circles) and 6 active (gray circles) fusiform cells. Low values of mean gKir are correlated with the active state, whereas high values of mean gKir are correlated with the quiet state (gKir quiet: 17.6 ± 1.8 nS; gKir active: 6.52 ± 1.76 nS; n = 6 for both conditions; P < 0.01, unpaired t-test). In addition, the variances of gKir in quiet and active cells are equal (Levene's test, P = 0.92). No correlation is observed between Gh and activity state (Gh quiet: 4.95 ± 1.27 nS; Gh active: 6.99 ± 1.15 nS; n = 6 for both conditions). The variances of Gh in quiet and active cells are equal (Levene's test; P = 0.91).
Fig. 8.
Fig. 8.
Variability in maximal Nap conductance (gNap) expression levels does not reach low-enough values, which allow for the transition from active to quiet state. Quiet and spontaneously active dynamics in a Hodgkin-Huxley style model of fusiform cell membrane potential activity (AD). A: model bifurcation diagram as the maximal KIR conductance, gKir, is varied (A1). Activity threshold (dashed trace) and the stable RMP (solid trace) coalesce in a saddle-node bifurcation. The experimentally measured gKir in quiet and spontaneously active cells straddles the bifurcation (marked with * and **), with the model producing either resting or rhythmic firing dynamics (A2). B: model bifurcation diagram as the gNap is varied. C: 2-parameter (gNap, gKir) bifurcation set, with a curve of saddle-node bifurcations separating quiet and active behavior. D: the concave, downward shape of the boundary between quiet and active dynamics predicts that gNap variability (ΔgNaP) across control, spontaneously active cells will contract when gNap is blocked with sufficient applied rizuole to transition the cell from active to quiet dynamics. E: comparison of experimentally measured gNap values in control active state with gNap values measured at the transition point from active to quiet state. INaP control was measured at the beginning of the experiment, and INaP trans was measured after riluzole application and at the time point where active neurons transition from active to quiet state. INaP control and INaP trans were measured at −50 mV, and these values were converted to conductances (gNap control: 4.86 ± 1 nS; gNap trans: 1.03 ± 0.3 nS; n = 7). Both means and variances were significantly different (P < 0.05).

References

    1. Achard P, De Schutter E. Complex parameter landscape for a complex neuron model. PLoS Comput Biol 2: e94, 2006 - PMC - PubMed
    1. Bellingham MC. A review of the neural mechanisms of action and clinical efficiency of riluzole in treating amyotrophic lateral sclerosis: what have we learned in the last decade? CNS Neurosci Ther 17: 4–31, 2011 - PMC - PubMed
    1. Cao XJ, Oertel D. The magnitudes of hyperpolarization-activated (Ih) and low-voltage-activated potassium (IKL) currents co-vary in neurons of the ventral cochlear nucleus. J Neurophysiol 106: 630–640, 2011 - PMC - PubMed
    1. Chelaru MI, Dragoi V. Efficient coding in heterogeneous neuronal populations. Proc Natl Acad Sci USA 105: 16344–16349, 2008 - PMC - PubMed
    1. Day M, Carr DB, Ulrich S, Ilijic E, Tkatch T, Surmeier DJ. Dendritic excitability of mouse frontal cortex pyramidal neurons is shaped by the interaction among HCN, Kir2, and Kleak channels. J Neurosci 25: 8776–8787, 2005 - PMC - PubMed

Publication types

Substances