Randomized Controlled Trial
. 2012 Jun;107(11):2950-7.
doi: 10.1152/jn.00645.2011. Epub 2012 Feb 29.

Modulating locomotor adaptation with cerebellar stimulation

Affiliations
Randomized Controlled Trial

Modulating locomotor adaptation with cerebellar stimulation

Gowri Jayaram et al. J Neurophysiol. 2012 Jun.

Abstract

Human locomotor adaptation is necessary to maintain flexibility of walking. Several lines of research suggest that the cerebellum plays a critical role in motor adaptation. In this study we investigated the effects of noninvasive stimulation of the cerebellum to enhance locomotor adaptation. We found that anodal cerebellar transcranial direct current stimulation (tDCS) applied during adaptation expedited the adaptive process while cathodal cerebellar tDCS slowed it down, without affecting the rate of de-adaptation of the new locomotor pattern. Interestingly, cerebellar tDCS affected the adaptation rate of spatial but not temporal elements of walking. It may be that spatial and temporal control mechanisms are accessible through different neural circuits. Our results suggest that tDCS could be used as a tool to modulate locomotor training in neurological patients with gait impairments.


Figures

Fig. 1.
Fig. 1.
A: experimental paradigm showing the periods of split-belt walking and conditions. tDCS, direct current stimulation. B: illustration of the fast (gray) and slow (black) step lengths that are used to calculate step symmetry. C: step lengths can return to symmetry by a spatial strategy, shifting the center of oscillation, or by a temporal strategy, by changing the phasing between the limbs. Circles refer to heel strike (HS) of the fast (black) and slow (gray) leg.
Fig. 2.
Fig. 2.
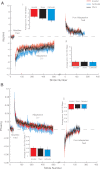
Step symmetry plotted stride by stride for the 3 stimulation groups where we stimulated the cerebellar hemisphere ipsilateral to the fast leg, with SE indicated by the shaded areas. Baseline values are subtracted from the curves (i.e., symmetry is indicated by a value of 0). i: average step symmetry for the first 150 steps of adaptation. ii: average step symmetry from the first 150 steps of de-adaptation. *P < 0.05.
Fig. 3.
Fig. 3.
Step symmetry plotted stride by stride for the 3 stimulation groups where we stimulated the cerebellar hemisphere ipsilateral to the fast leg. Each group has been fitted with a single exponential function. The decay constant (95% confidence interval) in steps was 8.7 (7.55, 9.86) for the anodal group (red), 31.12 (26.91, 35.33) for the cathodal group (blue), and 12.16 (10.96, 13.36) for the sham group (black).
Fig. 4.
Fig. 4.
A: center of oscillation plotted stride by stride for the 3 stimulation groups where we stimulated the cerebellar hemisphere ipsilateral to the fast leg, with SE indicated by the shaded areas. Baseline values are subtracted from the curves (i.e., symmetry is indicated by a value of 0). i: average center of oscillation for the first 150 steps of adaptation. ii: average center of oscillation from the first 150 steps of de-adaptation. B: phasing plotted stride by stride for the 3 stimulation groups where we stimulated the cerebellar hemisphere ipsilateral to the fast leg, with SE indicated by the shaded areas. Baseline values are subtracted from the curves (i.e., symmetry is indicated by a value of 0). i: average phasing for the first 150 steps of adaptation. ii: average phasing from the first 150 steps of de-adaptation.
Fig. 5.
Fig. 5.
Step symmetry plotted stride by stride for the 3 stimulation groups where we stimulated the cerebellar hemisphere ipsilateral to the slow leg, with SE indicated by the shaded areas. Baseline values are subtracted from the curves (i.e., symmetry is indicated by a value of 0). i: average step symmetry for the first 150 steps of adaptation. ii: average step symmetry from the first 150 steps of de-adaptation.

References

    1. Bastian AJ. Understanding sensorimotor adaptation and learning for rehabilitation. Curr Opin Neurol 21: 628–633, 2008 - PMC - PubMed
    1. Boggio PS, Ferrucci R, Rigonatti SP, Covre P, Nitsche M, Pascual-Leone A, Fregni F. Effects of transcranial direct current stimulation on working memory in patients with Parkinson's disease. J Neurol Sci 249: 31–38, 2006 - PubMed
    1. Choi J, Bastian AJ. Adaptation reveals independent control networks for human walking. Nat Neurosci 10: 1055–1062, 2007 - PubMed
    1. Daskalakis ZJ, Paradiso GO, Christensen BK. Exploring the connectivity between the cerebellum and motor cortex in humans. J Physiol 557: 689–700, 2004 - PMC - PubMed
    1. Fitzpatrick RC, Wardman DL, Taylor JL. Effects of galvanic vestibular stimulation during human walking. J Physiol 517: 931–939, 1999 - PMC - PubMed

Publication types

LinkOut - more resources