

Neural integration of speech and gesture in schizophrenia: evidence for differential processing of metaphoric gestures
- PMID: 22378493
- PMCID: PMC6870001
- DOI: 10.1002/hbm.22015
Neural integration of speech and gesture in schizophrenia: evidence for differential processing of metaphoric gestures
Abstract
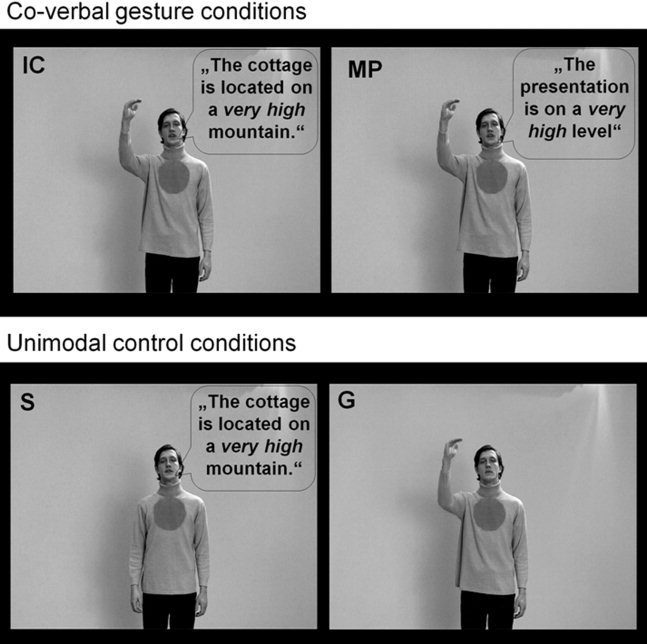
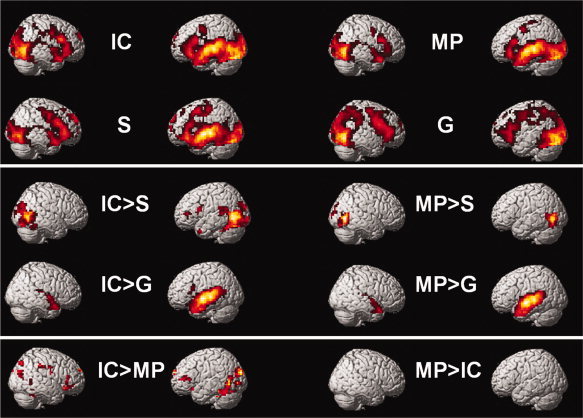
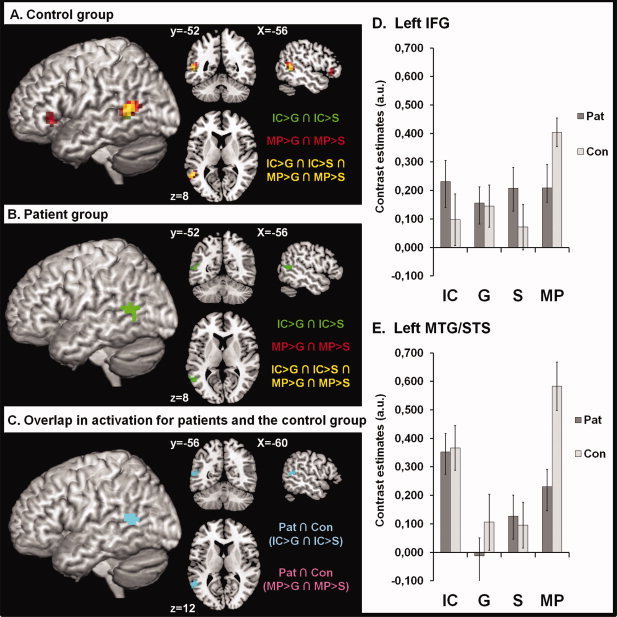
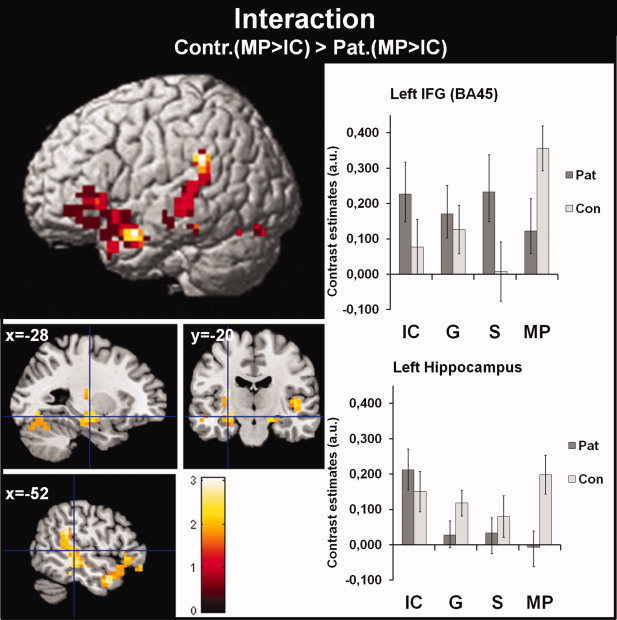
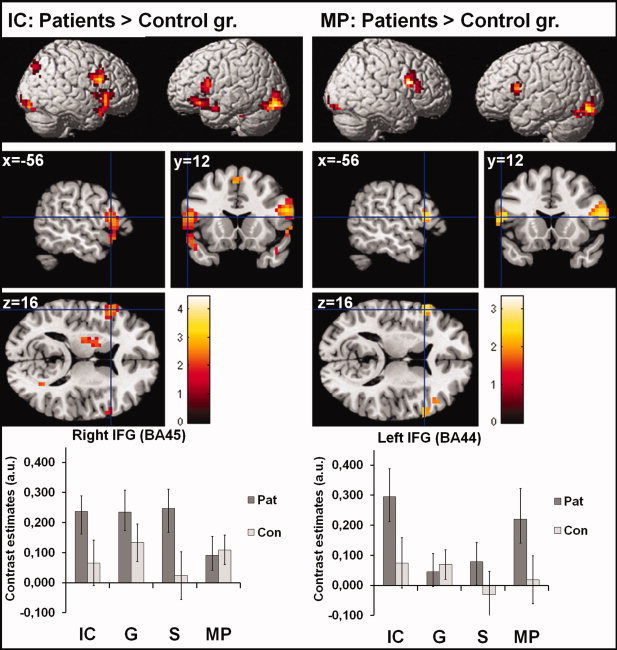
Gestures are an important component of interpersonal communication. Especially, complex multimodal communication is assumed to be disrupted in patients with schizophrenia. In healthy subjects, differential neural integration processes for gestures in the context of concrete [iconic (IC) gestures] and abstract sentence contents [metaphoric (MP) gestures] had been demonstrated. With this study we wanted to investigate neural integration processes for both gesture types in patients with schizophrenia. During functional magnetic resonance imaging-data acquisition, 16 patients with schizophrenia (P) and a healthy control group (C) were shown videos of an actor performing IC and MP gestures and associated sentences. An isolated gesture (G) and isolated sentence condition (S) were included to separate unimodal from bimodal effects at the neural level. During IC conditions (IC > G ∩ IC > S) we found increased activity in the left posterior middle temporal gyrus (pMTG) in both groups. Whereas in the control group the left pMTG and the inferior frontal gyrus (IFG) were activated for the MP conditions (MP > G ∩ MP > S), no significant activation was found for the identical contrast in patients. The interaction of group (P/C) and gesture condition (MP/IC) revealed activation in the bilateral hippocampus, the left middle/superior temporal and IFG. Activation of the pMTG for the IC condition in both groups indicates intact neural integration of IC gestures in schizophrenia. However, failure to activate the left pMTG and IFG for MP co-verbal gestures suggests a disturbed integration of gestures embedded in an abstract sentence context. This study provides new insight into the neural integration of co-verbal gestures in patients with schizophrenia.
Copyright © 2012 Wiley Periodicals, Inc.
Figures
Similar articles
-
Superior temporal sulcus disconnectivity during processing of metaphoric gestures in schizophrenia.Schizophr Bull. 2014 Jul;40(4):936-44. doi: 10.1093/schbul/sbt110. Epub 2013 Aug 16. Schizophr Bull. 2014. PMID: 23956120 Free PMC article.
-
The differentiation of iconic and metaphoric gestures: common and unique integration processes.Hum Brain Mapp. 2011 Apr;32(4):520-33. doi: 10.1002/hbm.21041. Hum Brain Mapp. 2011. PMID: 21391245 Free PMC article.
-
Memory effects of speech and gesture binding: cortical and hippocampal activation in relation to subsequent memory performance.J Cogn Neurosci. 2009 Apr;21(4):821-36. doi: 10.1162/jocn.2009.21053. J Cogn Neurosci. 2009. PMID: 18578601
-
Modulating the assessment of semantic speech-gesture relatedness via transcranial direct current stimulation of the left frontal cortex.Brain Stimul. 2017 Mar-Apr;10(2):223-230. doi: 10.1016/j.brs.2016.10.012. Epub 2016 Oct 25. Brain Stimul. 2017. PMID: 27815051
-
Hearing and seeing meaning in speech and gesture: insights from brain and behaviour.Philos Trans R Soc Lond B Biol Sci. 2014 Sep 19;369(1651):20130296. doi: 10.1098/rstb.2013.0296. Philos Trans R Soc Lond B Biol Sci. 2014. PMID: 25092664 Free PMC article. Review.
Cited by
-
Transcranial Direct Current Stimulation Improves Semantic Speech-Gesture Matching in Patients With Schizophrenia Spectrum Disorder.Schizophr Bull. 2019 Apr 25;45(3):522-530. doi: 10.1093/schbul/sby144. Schizophr Bull. 2019. PMID: 30304518 Free PMC article.
-
Supramodal neural processing of abstract information conveyed by speech and gesture.Front Behav Neurosci. 2013 Sep 13;7:120. doi: 10.3389/fnbeh.2013.00120. eCollection 2013. Front Behav Neurosci. 2013. PMID: 24062652 Free PMC article.
-
Neural correlates of semantic associations in patients with schizophrenia.Eur Arch Psychiatry Clin Neurosci. 2014 Mar;264(2):143-54. doi: 10.1007/s00406-013-0425-0. Epub 2013 Jul 24. Eur Arch Psychiatry Clin Neurosci. 2014. PMID: 23880958
-
A systematic review of the neural correlates of multisensory integration in schizophrenia.Schizophr Res Cogn. 2021 Oct 5;27:100219. doi: 10.1016/j.scog.2021.100219. eCollection 2022 Mar. Schizophr Res Cogn. 2021. PMID: 34660211 Free PMC article.
-
Meta-Analysis of Functional Neuroimaging and Cognitive Control Studies in Schizophrenia: Preliminary Elucidation of a Core Dysfunctional Timing Network.Front Psychol. 2016 Feb 17;7:192. doi: 10.3389/fpsyg.2016.00192. eCollection 2016. Front Psychol. 2016. PMID: 26925013 Free PMC article.
References
-
- Amedi A, von Kriegstein K, van Atteveldt NM, Beauchamp MS, Naumer MJ ( 2005): Functional imaging of human crossmodal identification and object recognition. Exp Brain Res 166: 559–571. - PubMed
-
- Andreasen NC ( 1983): Scale for the Assessment of Negative Symptoms (SANS). Iowa City, IA: University of Iowa.
-
- Andreasen NC ( 1984). Scale for the Assessment of Positive Symptoms (SAPS). Iowa City, IA: University of Iowa.
Publication types
MeSH terms
Substances
LinkOut - more resources
Full Text Sources
Medical
