

Mapping hidden potential identity elements by computing the average discriminating power of individual tRNA positions
- PMID: 22378766
- PMCID: PMC3372374
- DOI: 10.1093/dnares/dss008
Mapping hidden potential identity elements by computing the average discriminating power of individual tRNA positions
Abstract
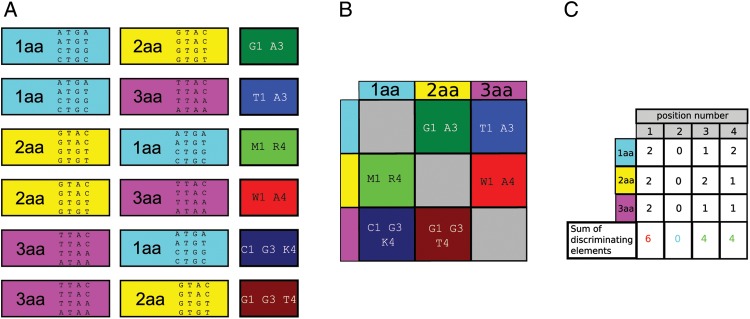
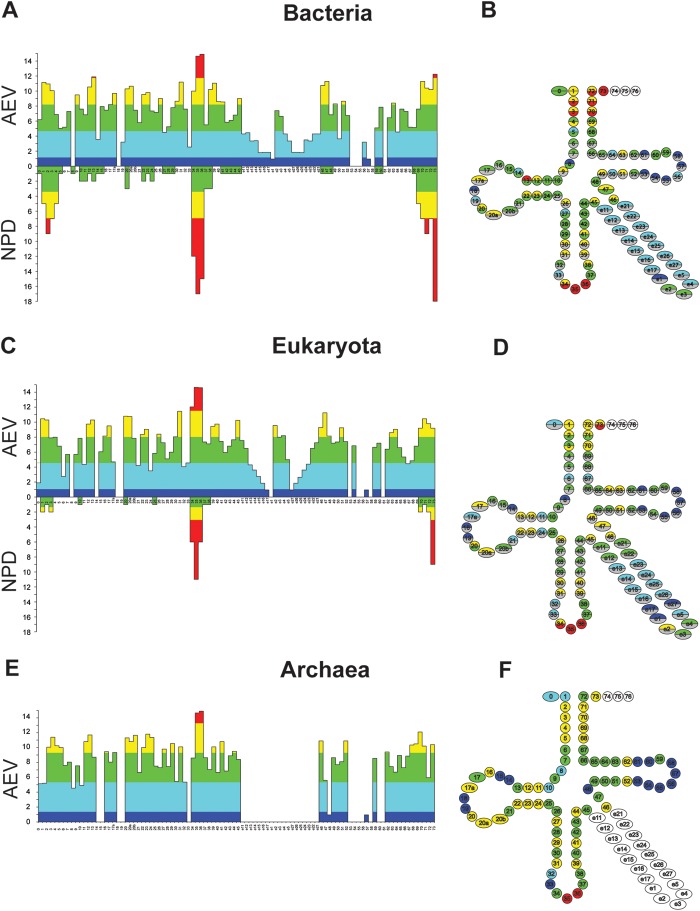
The recently published discrete mathematical method, extended consensus partition (ECP), identifies nucleotide types at each position that are strictly absent from a given sequence set, while occur in other sets. These are defined as discriminating elements (DEs). In this study using the ECP approach, we mapped potential hidden identity elements that discriminate the 20 different tRNA identities. We filtered the tDNA data set for the obligatory presence of well-established tRNA features, and then separately for each identity set, the presence of already experimentally identified strictly present identity elements. The analysis was performed on the three kingdoms of life. We determined the number of DE, e.g. the number of sets discriminated by the given position, for each tRNA position of each tRNA identity set. Then, from the positional DE numbers obtained from the 380 pairwise comparisons of the 20 identity sets, we calculated the average excluding value (AEV) for each tRNA position. The AEV provides a measure on the overall discriminating power of each position. Using a statistical analysis, we show that positional AEVs correlate with the number of already identified identity elements. Positions having high AEV but lacking published identity elements predict hitherto undiscovered tRNA identity elements.
Figures
Similar articles
-
In silico detection of tRNA sequence features characteristic to aminoacyl-tRNA synthetase class membership.Nucleic Acids Res. 2007;35(16):5593-609. doi: 10.1093/nar/gkm598. Epub 2007 Aug 17. Nucleic Acids Res. 2007. PMID: 17704131 Free PMC article.
-
Identity elements of archaeal tRNA.DNA Res. 2005;12(4):235-46. doi: 10.1093/dnares/dsi008. DNA Res. 2005. PMID: 16769686
-
Similarities and differences in tRNA identity between Escherichia coli and Saccharomyces cerevisiae: evolutionary conservation and divergence.Nucleic Acids Symp Ser. 1995;(34):205-6. Nucleic Acids Symp Ser. 1995. PMID: 8841624
-
Computational analysis of tRNA identity.FEBS Lett. 2010 Jan 21;584(2):325-33. doi: 10.1016/j.febslet.2009.11.084. FEBS Lett. 2010. PMID: 19944694 Review.
-
Discriminating among the discriminator bases of tRNAs.Chem Biol. 1997 Feb;4(2):93-6. doi: 10.1016/s1074-5521(97)90252-0. Chem Biol. 1997. PMID: 9190291 Review.
Cited by
-
Does the genetic code have a eukaryotic origin?Genomics Proteomics Bioinformatics. 2013 Feb;11(1):41-55. doi: 10.1016/j.gpb.2013.01.001. Epub 2013 Jan 20. Genomics Proteomics Bioinformatics. 2013. PMID: 23402863 Free PMC article.
-
The tRNA identity landscape for aminoacylation and beyond.Nucleic Acids Res. 2023 Feb 28;51(4):1528-1570. doi: 10.1093/nar/gkad007. Nucleic Acids Res. 2023. PMID: 36744444 Free PMC article. Review.
-
Identifying the ligated amino acid of archaeal tRNAs based on positions outside the anticodon.RNA. 2016 Oct;22(10):1477-91. doi: 10.1261/rna.053777.115. Epub 2016 Aug 11. RNA. 2016. PMID: 27516383 Free PMC article.
References
-
- Cavarelli J., Moras D. Recognition of tRNAs by aminoacyl-tRNA synthetases. FASEB J. 1993;7:79–86. - PubMed
-
- McClain W.H. Rules that govern tRNA identity in protein synthesis. J. Mol. Biol. 1993;234:257–80. - PubMed
-
- Ibba M., Soll D. Aminoacyl-tRNA synthesis. Annu. Rev. Biochem. 2000;69:617–50. - PubMed
-
- Giege R. Toward a more complete view of tRNA biology. Nat. Struct. Mol. Biol. 2008;15:1007–14. - PubMed
Publication types
MeSH terms
Substances
LinkOut - more resources
Full Text Sources
