. 2012 Apr 19;119(16):3820-7.
doi: 10.1182/blood-2011-09-380485. Epub 2012 Feb 29.

The hypersensitive sites of the murine β-globin locus control region act independently to affect nuclear localization and transcriptional elongation

Affiliations

The hypersensitive sites of the murine β-globin locus control region act independently to affect nuclear localization and transcriptional elongation

M A Bender et al. Blood. .

Abstract

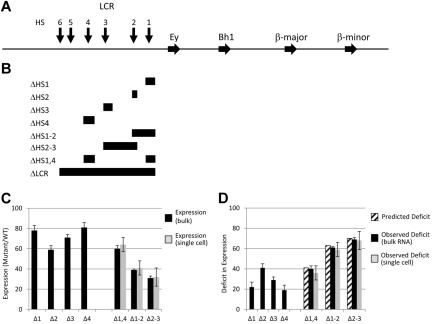
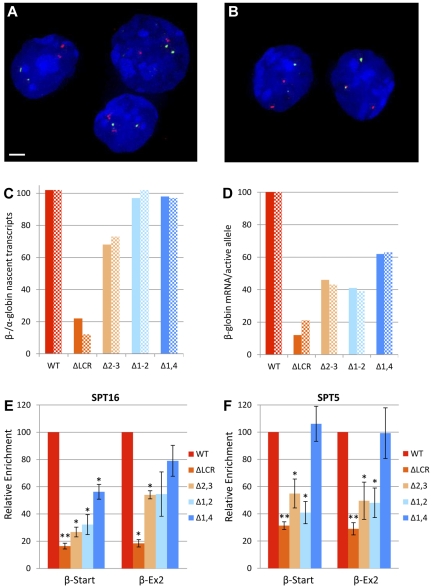
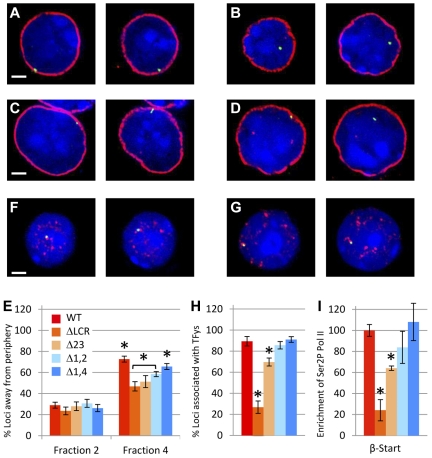
The β-globin locus control region (LCR) is necessary for high-level β-globin gene transcription and differentiation-dependent relocation of the β-globin locus from the nuclear periphery to the central nucleoplasm and to foci of hyperphosphorylated Pol II "transcription factories" (TFys). To determine the contribution of individual LCR DNaseI hypersensitive sites (HSs) to transcription and nuclear location, in the present study, we compared β-globin gene activity and location in erythroid cells derived from mice with deletions of individual HSs, deletions of 2 HSs, and deletion of the whole LCR and found all of the HSs had a similar spectrum of activities, albeit to different degrees. Each HS acts as an independent module to activate expression in an additive manner, and this is correlated with relocation away from the nuclear periphery. In contrast, HSs have redundant activities with respect to association with TFys and the probability that an allele is actively transcribed, as measured by primary RNA transcript FISH. The limiting effect on RNA levels occurs after β-globin genes associate with TFys, at which time HSs contribute to the amount of RNA arising from each burst of transcription by stimulating transcriptional elongation.


Figures

Figure 1
Figure 1
Map of LCR deletions obtained by homologous recombination and the expression analysis of the resulting mutant mice. (A) Map of the mouse β-globin locus. Blocks with arrowheads represent genes. Vertical arrows represent LCR HSs. (B) Diagrammatic representation of the targeted deletions generated and discussed in the text. Each block demonstrates the extent of the deletion listed on the left of the panel. Note that the Δ1-2 and Δ2-3 deletions remove all sequences from the 5′ border to the 3′ border of the corresponding single HS deletions, thus removing sequences between the 2 HSs. In contrast, the Δ1,4 deletion only removes the sequences present in the 2 single HS deletions. (C) Adult β-globin expression resulting from LCR HS deletions. The level of expression from a mutant allele relative to that of a WT allele in heterozygotic mice is presented as a percentage with the SD denoted (see “The β-globin LCR HSs contribute to transcription in an addictive, not synergistic manner” and Table 1 for details). Black bars are data from tissue RNA preparations and light bars are data from single-cell analyses. (D) Deficit in adult β-globin expression resulting from LCR HS deletions. The deficit in expression of a mutant allele compared with a WT allele in heterozygotic mice was calculated by subtracting the expression level (Figure 1C) from 100% and is presented with the SD (see “The β-globin LCR HSs contribute to transcription in an addictive, not synergistic manner” and Table 2 for details). Striped bars are the calculated deficit that would be observed in double HS deletion mice if HSs contribute to expression in an additive manner. Black bars are data from tissue RNA preparations and light bars are data from single-cell analyses.
Figure 2
Figure 2
Expression and elongation studies in cells homozygous for WT or LCR mutant β-globin loci. (A-D) Expression of α- and β-globin from WT and mutant alleles during erythroid differentiation by primary transcript RNA FISH. Fetal liver cells from at least 6 homozygous WT or homozygous mutant fetuses were fractionated by flow cytometry and probed for α-globin (red) and β-major primary transcripts (green) by RNA FISH, followed by counterstaining of nuclei by DAPI staining (blue). Scale bar indicates 2 μm. Representative images from WT mice of fraction 3 (A) and fraction 4 (B) are shown. (C) Ratio of β-globin to α-globin nascent transcripts. Values are the ratio of β-globin to α-globin alleles with bursts of active transcription (foci of nascent transcripts) shown as a percentage. Solid bars represent values for fraction 3 and hatched bars are fraction 4. More than 100 cells were analyzed for each data point. (D) β-globin mRNA per active allele. To obtain an estimate of the relative mRNA production from each burst of active transcription, we compared the effect of each mutation on mRNA production (Table 2) with its effect on bursts of transcription (Figure 2C). Values are the ratio of the percentage of WT β-globin mRNA accumulation for each mutation to the percentage of WT alleles associated with foci of nascent transcripts. Solid bars represent data using fraction 3 and hatched bars are fraction 4. Values are divided by 1.02 so that WT yields 100%. (E-F) Recruitment of elongation components to the β-globin locus in erythroid cells from mice homozygous for LCR HS deletions normalized to WT. ChIP was performed on WT and LCR mutant chromatin using Abs to FACT component SPT16 (E) and DSIF component SPT5 (F). Three different chromatin preparations were analyzed by quantitative RT-PCR of the β-major globin start site (β-Start) and exon-2 of β-major (β-Ex2) regions and normalized to necdin, which is not transcribed in these cells. Values for each mutant line were normalized to the WT line (*P < .05 and **P < .001 relative to WT). The same data without normalization to WT is shown in supplemental Figure 1A and B. Error bars represent the SEM.
Figure 3
Figure 3
Nuclear localization studies in cells homozygous for WT or LCR mutant β-globin loci. (A-E) Relocalization of the WT and mutant β-globin loci away from the nuclear periphery during erythroid differentiation. Fetal liver cells from at least 6 homozygous WT or homozygous mutant fetuses were fractionated by flow cytometry and probed by DNA FISH (green), followed by immunostaining of LaminB1 (red) to define the nuclear periphery and counterstaining of nuclei by DAPI staining (blue). Scale bar indicates 2 μm. Representative images from WT and Δ1-2 cells of fraction 2 (A,C) and fraction 4 (B,D) are shown. Images are single z-sections, so the diameter of the nucleus varies depending on the level of the slice. (E) Percentage of β-globin loci located away from the nuclear periphery in immature (fraction 2) and mature (fraction 4) erythroid cells. In fraction 2, no significant differences between WT and LCR HS mutants are present. In contrast, in fraction 4, significantly more WT alleles are located away from the nuclear periphery than for each of LCR HS-deleted lines (*P < .05). Values also vary significantly between Δ1,4 and all other mutants (P < .05) and between the ΔLCR and Δ1-2 mutations (bracketed and shown by asterisks). More than 100 loci were analyzed for each data point. Error bars represent the SEM. (F-I) Association of WT and β-globin loci to foci of hyperphosphorylated Pol II. (F-H) Fetal liver cells from at least 6 homozygous WT or homozygous mutant fetuses were fractionated by flow cytometry and probed by DNA FISH (green), followed by immunostaining of phospho-Pol II (red) to define transcription factories and counterstaining of nuclei by DAPI staining (blue). Scale bar indicates 2 μm. Representative images from WT (F) and Δ1-2 (G) cells are shown. Both alleles are shown in their respective z-sections. (H) Percentage of β-globin loci overlapping with TFys in mature erythroid cells (fraction 4). Association frequency of the ΔLCR and Δ2-3 mutant alleles with TFys differs significantly from all other genotypes (*P < .05). WT, Δ1-2, and Δ1,4 did not differ significantly from each other. More than 50 loci were analyzed for each data point. Error bars represent the SEM. (I) Recruitment of hyperphosphorylated Pol II to the β-globin gene in erythroid cells from mice homozygous for LCR HS deletions normalized to WT. ChIP was performed on WT and LCR mutant chromatin using a phosphorylated form of PolII. Three different chromatin preparations were analyzed by quantitative RT-PCR of the β-major globin start site (β-Start) and normalized to actin. Values for each mutant line were normalized to the WT line (*P < .05 relative to WT).

References

    1. Bender MA, Bulger M, Close J, Groudine M. Beta-globin gene switching and DNase I sensitivity of the endogenous beta-globin locus in mice do not require the locus control region. Mol Cell. 2000;5(2):387–393. - PubMed
    1. Li Q, Peterson KR, Fang X, Stamatoyannopoulos G. Locus control regions. Blood. 2002;100(9):3077–3086. - PMC - PubMed
    1. Stamatoyannopoulos G, Grosveld F. Hemoglobin switching. In: Stamatoyannopoulos G, Majerus PW, Perlmutter R, Varmus H, editors. The Molecular Basis of Blood Diseases. Philadelphia, PA: Saunders; 2001. pp. 135–182.
    1. Bungert J, Tanimoto K, Patel S, Liu Q, Fear M, Engel JD. Hypersensitive site 2 specifies a unique function within the human beta-globin locus control region to stimulate globin gene transcription. Mol Cell Biol. 1999;19(4):3062–3072. - PMC - PubMed
    1. Fraser P, Pruzina S, Antoniou M, Grosveld F. Each hypersensitive site of the human beta-globin locus control region confers a different developmental pattern of expression on the globin genes. Genes Dev. 1993;7(1):106–113. - PubMed

Publication types