Comparative Study
. 2012 Feb 29;32(9):3261-6.
doi: 10.1523/JNEUROSCI.5024-11.2012.

Nicotinic receptor-mediated filtering of mitral cell responses to olfactory nerve inputs involves the α3β4 subtype

Affiliations
Comparative Study

Nicotinic receptor-mediated filtering of mitral cell responses to olfactory nerve inputs involves the α3β4 subtype

Rinaldo D D'Souza et al. J Neurosci. .

Abstract

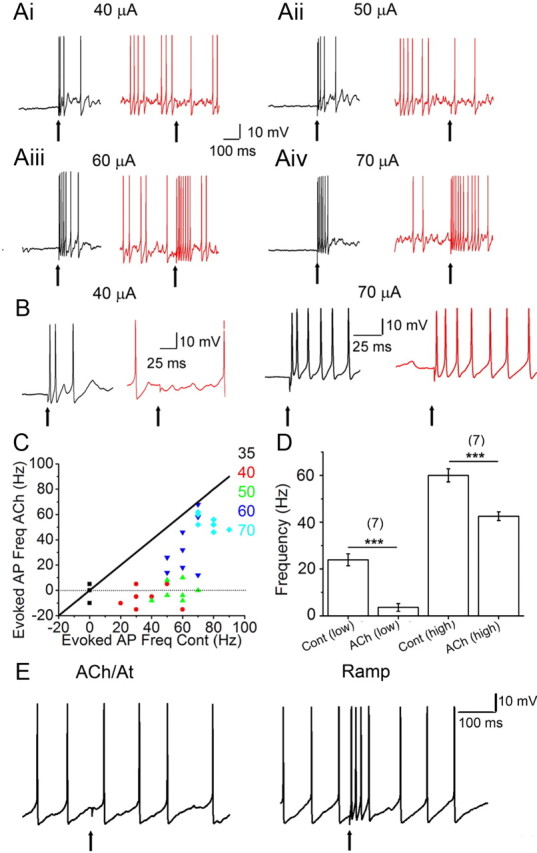
Acetylcholine (ACh) plays a major role in the processing of sensory inputs. Cholinergic input to the mammalian olfactory bulb modulates odor discrimination and perceptual learning by mechanisms that have yet to be elucidated. We have used the mouse olfactory bulb to examine the role of nicotinic ACh receptors (nAChRs) in regulating the responses of mitral cells (MCs), the output neurons of the olfactory bulb, to olfactory nerve input. We show that ACh activates α3β4* nAChRs (* denotes the possible presence of other subunits) on MCs, leading to their excitation. Despite depolarizing MCs directly, the net effect of nAChR activation is to suppress olfactory nerve-evoked responses in these cells via activity-dependent feedback GABAergic mechanisms. Our results indicate that nAChRs gate incoming olfactory nerve input wherein weak input stimuli are filtered out, whereas strong stimuli are transmitted via the MCs. Based on our observations, we provide a mechanistic model for the sharpening of MC receptive fields by nAChRs, which could aid in odor discrimination and perceptual learning.


Figures

Figure 1.
Figure 1.
nAChR effects on MCs. Ai, MCs loaded with 50 μm Alexa 488 dextran exhibit an intact primary dendrite that arborizes in a glomerulus. The white circle demarcates the approximate outline of the glomerulus. Scale bar, 20 μm. Aii, Local application of 1 mm ACh/At (5 s puffs start at arrows) in the glomerulus results in inward currents in the MC shown in Ai. Holding potential = −40 mV. Aiii, sIPSCs (upward deflections) impinge on the inward currents shown in the trace. Below the trace is shown a frequency plot of the sIPSCs. Dashed lines show the current onset and peak. Aiv, Expanded trace during the ACh/At burst showing individual sIPSCs. B, Left, Another MC exhibits a cut primary dendrite (arrow) but intact lateral dendrites (same scale as in Ai). Right, Trace shows that local application of 1 mm ACh/At (horizontal line) in the glomerular layer led to a small increase in sIPSC frequency, but resulted in no observable current. The sIPSC frequency plot for the trace shows a small increase in events. C, Left, Focal application of ACh/At onto the MC glomerular tuft induced larger currents than when it was puffed onto the soma (***p < 0.0001). ACh/At application on the soma of MCs that had an intact primary dendrite did not induce significantly different (n.s.) currents from applications on the soma of MCs without glomerular tufts, thus arguing against diffusion of the agonist. Intact (glom), ACh/At application on glomerular tuft; Intact (soma), application on the soma of MCs with intact primary dendrites; Cut (soma), application on the soma of MCs that lacked a glomerular tuft. Numbers in parentheses are the numbers of cells tested. Right, Intact MCs exhibited a much larger increase in sIPSC frequency than did cut MCs on glomerular ACh/At applications (***p < 0.0001; **p < 0.01). However, MCs with cut primary dendrites did exhibit a small increase in sIPSCs when the agonist was applied at the glomerulus (p < 0.05). This small increase in sIPSCs probably arises from downstream activation of granule cells upon MC excitation. Cont, Control (basal sIPSC frequency); ACh, sIPSC frequency upon ACh/At application.
Figure 2.
Figure 2.
Pharmacology of nAChR effects. A, Representative traces showing control response to ACh/At (black) and response in the presence of nAChR antagonist (red) and after a 15 min wash (green). All currents were recorded at −70 mV, and sIPSCs were recorded at −40 mV. Ai, Left, 5 μm mecamylamine (Mec). Center, 100 nm MLA. Right, 100 μm DHβE. Aii, 10 μm DHβE. Aiii, 10 μm CTx-AuIB. Among subtype-specific antagonists CTx-AuIB was the most effective in suppressing nAChR currents. Scale bars, 100 pA/5 s. B, Pooled data showing the block of nAChR currents (left) and sIPSC increases (right) by various antagonists. Both DHβE and CTx-AuIB inhibited the sIPSC increases. The y-axis shows responses normalized to control. MLA had no effect on either (n.s.). *p < 0.05; ***p < 0.0001.
Figure 3.
Figure 3.
nAChR activation suppresses ON-evoked responses in MCs. Ai, Voltage-clamp recording from a representative MC. The ON was electrically stimulated at the two black arrows. A 1 s, 1 mm ACh/At puff was focally applied at the red arrow. Aii, Top traces, Left, Expanded trace of the ON-evoked EPSC from Ai under control conditions. Right, During the ACh/At-induced current, the eEPSC in Ai is suppressed. Bottom traces, During bath application of 10 μm GBz and 1 μm CGP 54626. Left, An eEPSC from the same cell as in Ai, in the presence of the GABA receptor blockers. Right, In the presence of the GABA receptor blockers, during the ACh-induced current, the nAChR-mediated suppression of eEPSCs is abolished. B, Left, Data from a single MC showing eEPSCs elicited by ON stimulation at various intensities (30–80 μA). Right, The same cell shows suppression of all ON responses when elicited during the ACh/At-induced currents. C, Left, Amplitude histogram showing a leftward shift of eEPSC amplitude distributions for relatively weak ON stimulation intensities in the presence of ACh/At (black) compared with control (gray; n = 8, p < 0.0001). Center, Similar leftward shift is observed for high ON stimulation intensities. eEPSC values in the left and center panels were normalized to the mean eEPSC values under control conditions for high stimulus intensities. Right, In the presence of 10 μm GBz + 1 μm CGP-54626, the leftward shift of the eEPSC distribution was abolished (black) and was significantly shifted to the right of the control distribution (gray; n = 5, p < 0.03, K-S test).
Figure 4.
Figure 4.
Nicotinic filtering of weak ON inputs. Ai, Same experimental setup as in Figure 3A, but under current clamp. Left, A 40 μA ON stimulus causes an MC to exhibit a burst of spikes. Right, During the ACh/At-mediated depolarization (and enhanced background firing), the 40 μA stimulus fails to evoke a response in the same MC. AiiAiv, Similar data for 50 (Aii), 60 (Aiii), and 70 (Aiv) μA stimuli. Whereas the 50 μA stimulus also fails to evoke a response during the ACh/At-mediated spiking in the same MC as in Ai, the MC responds to higher stimuli with increased spiking. In all cases, control traces are in black, and traces in the presence of ACh/At are in red. B, Expanded traces from Ai and Aiv. C, Scatter plot of net increase in spiking upon ON stimulation, during the ACh/At-mediated depolarization, plotted against the same during control conditions. Data are from the same cell as in AiAiv and B. Numbers indicate stimulus intensities in microamps. Whereas responses to all stimulus intensities were suppressed during the ACh-mediated depolarization, lower intensity stimuli (up to 50 μA) show a filtering of MC responses (not different from 0). Diagonal line (slope = 1) shows an arbitrary line where the points would lie if there was no ACh-mediated filtering. D, Pooled data from seven MCs for the lowest intensity that exhibited an ON-evoked response under control conditions and the highest stimulus intensity. At both intensities the net firing frequency was reduced upon nAChR activation (***p < 0.0001). For low intensities, stimulating the ON during the ACh/At-induced depolarization (ACh low) did not evoke a significant increase in MC firing (p = 0.76, not significant from 0), thus suggesting a filtering mechanism. E, Filtering shown in the presence of ACh/At (left) is not seen when the same cell is depolarized to elicit APs in the absence of ACh/At (right; Ramp, from the same cell). The same stimulus intensities were used for both conditions.

Similar articles

Cited by

References

    1. Castillo PE, Carleton A, Vincent JD, Lledo PM. Multiple and opposing roles of cholinergic transmission in the main olfactory bulb. J Neurosci. 1999;19:9180–9191. - PMC - PubMed
    1. Chaudhury D, Escanilla O, Linster C. Bulbar acetylcholine enhances neural and perceptual odor discrimination. J Neurosci. 2009;29:52–60. - PMC - PubMed
    1. Dani JA, Bertrand D. Nicotinic acetylcholine receptors and nicotinic cholinergic mechanisms of the central nervous system. Annu Rev Pharmacol Toxicol. 2007;47:699–729. - PubMed
    1. De Saint Jan D, Hirnet D, Westbrook GL, Charpak S. External tufted cells drive the output of olfactory bulb glomeruli. J Neurosci. 2009;29:2043–2052. - PMC - PubMed
    1. Ghatpande AS, Gelperin A. Presynaptic muscarinic receptors enhance glutamate release at the mitral/tufted to granule cell dendrodendritic synapse in the rat main olfactory bulb. J Neurophysiol. 2009;101:2052–2061. - PubMed

Publication types

LinkOut - more resources