Multicenter Study
. 2012 Feb 29;4(123):123ra25.
doi: 10.1126/scitranslmed.3003165.

HIV-specific cytolytic CD4 T cell responses during acute HIV infection predict disease outcome

Affiliations
Multicenter Study

HIV-specific cytolytic CD4 T cell responses during acute HIV infection predict disease outcome

Damien Z Soghoian et al. Sci Transl Med. .

Abstract

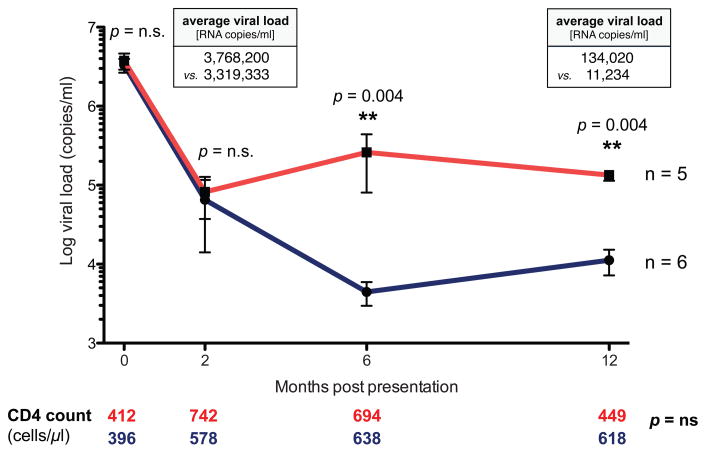
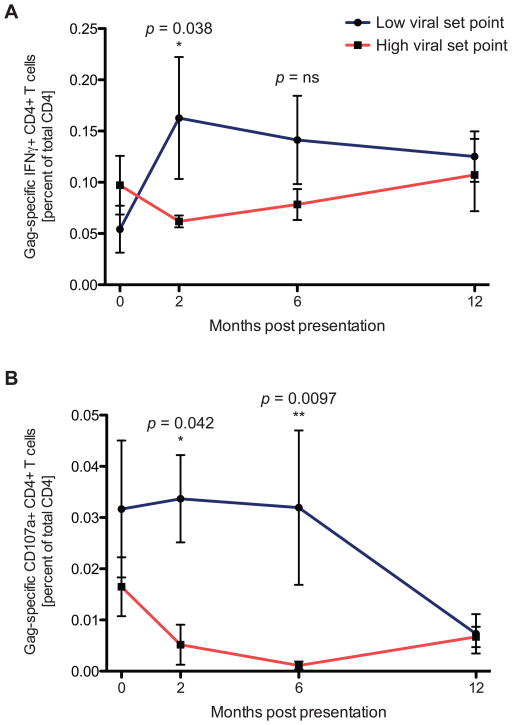
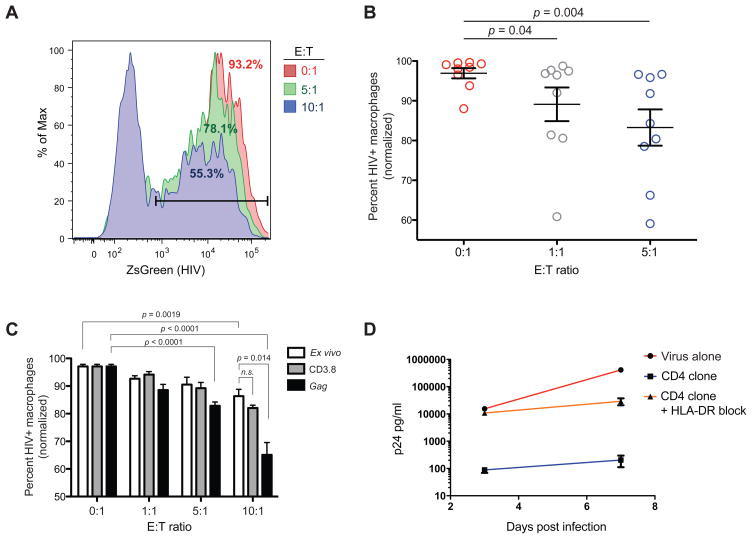
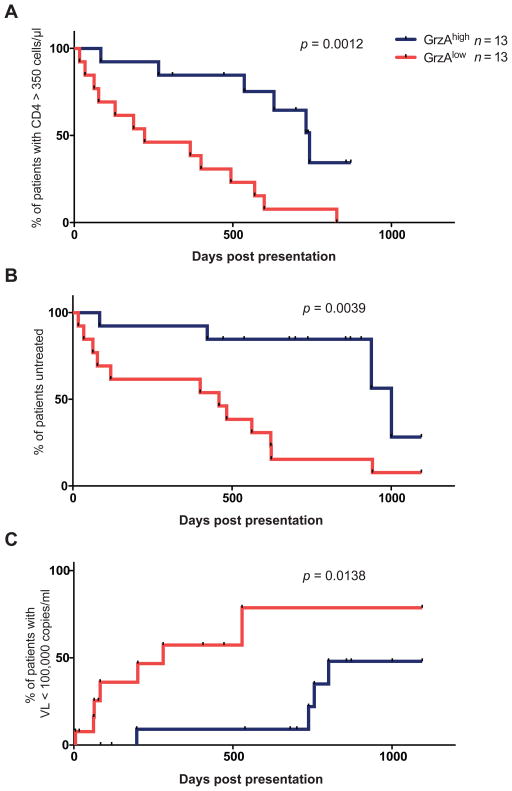
Early immunological events during acute HIV infection are thought to fundamentally influence long-term disease outcome. Whereas the contribution of HIV-specific CD8 T cell responses to early viral control is well established, the role of HIV-specific CD4 T cell responses in the control of viral replication after acute infection is unknown. A growing body of evidence suggests that CD4 T cells-besides their helper function-have the capacity to directly recognize and kill virally infected cells. In a longitudinal study of a cohort of individuals acutely infected with HIV, we observed that subjects able to spontaneously control HIV replication in the absence of antiretroviral therapy showed a significant expansion of HIV-specific CD4 T cell responses-but not CD8 T cell responses-compared to subjects who progressed to a high viral set point (P = 0.038). Markedly, this expansion occurred before differences in viral load or CD4 T cell count and was characterized by robust cytolytic activity and expression of a distinct profile of perforin and granzymes at the earliest time point. Kaplan-Meier analysis revealed that the emergence of granzyme A(+) HIV-specific CD4 T cell responses at baseline was highly predictive of slower disease progression and clinical outcome (average days to CD4 T cell count <350/μl was 575 versus 306, P = 0.001). These data demonstrate that HIV-specific CD4 T cell responses can be used during the earliest phase of HIV infection as an immunological predictor of subsequent viral set point and disease outcome. Moreover, these data suggest that expansion of granzyme A(+) HIV-specific cytolytic CD4 T cell responses early during acute HIV infection contributes substantially to the control of viral replication.


Conflict of interest statement

Competing interests: The authors declare that they have no competing interests.

Figures

Figure 1
Figure 1. Dynamics of viral load during acute HIV infection
11 acutely infected individuals were split into two groups based on their early viral set points. 5 individuals progressed to a high viral set point of 134,020 HIV RNA copies/ml one year after presentation (red); 6 subjects progressed to a significantly lower viral set point (11,234 copies/ml, p = 0.004, Mann-Whitney test) one year after presentation (blue). Average CD4 T cell counts for subjects progressing to high or low viral set points are denoted below the graph in red or blue, respectively, at each analysis time point.
Figure 2
Figure 2. HIV-specific CD4 T cell responses during acute HIV infection
HIV-specific CD4 T cell responses expand in acute HIV infection in subjects progressing to lower viral set points. (A) The Gag-specific IFNγ+ CD4 T response was evaluated longitudinally in individuals who progressed to a lower viral set point (blue, n=6) and in those who progressed to a high viral set point (red, n=5). A significant difference in the IFNγ response levels was noted at 2 months post presentation (p=0.038, Mann-Whitney test) (B) Longitudinal monitoring of the Gag-specific CD4 T cell degranulation (CD107a) response was performed following acute HIV infection in subjects progressing to low (blue, n=6) and high (red, n=5) viral set points. Significant differences in CD107a expressing CD4 T cells between patient groups are observable at both 2(0.034 versus 0.005; P = 0.042, Mann-Whitney test) and 4 months after presentation (0.032 versus 0.001; P = 0.0097, Mann-Whitney test).
Figure 3
Figure 3. CD4 T cells from HIV-infected subjects mediate viral suppression
Functional assays were performed to assess the ability of CD4 T cells from HIV-infected subjects to directly exhibit an antiviral effect. (A) Representative example of the results of one single-cycle macrophage inhibition assay; CD4 T cell effector cells were tested for their ability to reduce the number of macrophages infected with a ZsGreen reporter HIV at various effector to target (E:T) ratios. Percentages represent the number of HIV+ macrophages remaining at the end of the assay period. (B) CD4 T cells from a subset of the cohort of subjects analyzed longitudinally (n=9) were assessed for suppressive capacity in the single-cycle inhibition assay. Results are expressed as percentage of HIV+ autologous macrophages remaining and have been normalized to the respective maximum for each set of conditions. (C) CD4 T cells from a chronically HIV-infected patient were used as effectors in the single-cycle macrophage inhibition assay ex vivo or following non-specific (CD3.8) or Gag-specific expansion. (D) CD4 T cell clones were generated from the same chronically infected patient and assessed for their ability to inhibit viral replication in a standard 7 day viral inhibition assay using infected HLA-DR matched H9 cells as targets.
Figure 4
Figure 4. Baseline HIV-specific CD4 T cell responses and viral control
Baseline HIV-specific CD4 T cell responses enriched in Granzyme A are associated with viral control.(A) Representative example of flow cytometric analysis of the expression of the cytolytic effector molecules granzymes A, B, K, and perforin in HIV-specific IFNγ+ CD4 T cells. (B) Co-expression analysis of the expression of granzymes and perforin in Gag-responding CD4 T cells was performed to determine if differences in the cytolytic profile of these cells could be detected in the cohort of subjects analyzed longitudinally (n=11). Pie slices are colored according to the number of cytolytic molecules expressed in the Gag-specific CD4 T cell response (0: pattern; 1: yellow; 2: green; 3: blue, 4: red); the orange colored arc represents the fraction of the total HIV-specific IFNγ+ CD4 T cells expressing granzyme A. (C) Phenotypic analysis was performed to determine the ratio of Granzyme A to other cytolytic effector molecules within HIV-specific IFNγ-secreting CD4 T cells expressing at least one cytolytic enzyme in both patient groups (low set point, 43.2%, versus high set point, 13.4%; P = 0.019, Mann-Whitney test).
Figure 5
Figure 5. Cytolytic phenotype of HIV-specific CD4 T cells predicts clinical outcome
The cytolytic phenotype of the HIV-specific CD4 IFNγ response was measured at baseline in an expanded cohort of 26 patients comprised of the original patients evaluated longitudinally and additional patients meeting the same criteria for acute HIV infection. Subjects were stratified into two groups based on the presence of GrzAhigh CD4 T cell responses (blue lines, n = 13) or GrzAlow CD4 T cell responses (red lines, n = 13). Kaplan-Meier analysis was then performed to determine if differences between the two groups were present in (A) the time until CD4 counts declined to 350 cells/μl, (B) the time subjects remained off antiretroviral treatment, or (C) the length of time individuals were able to control viremia to levels below 100,000 HIV RNA copies/ml. P values denoted on the graphs represent Log-rank test results.

Comment in

References

    1. Douek DC, Brenchley JM, Betts MR, Ambrozak DR, Hill BJ, Okamoto Y, Casazza JP, Kuruppu J, Kunstman K, Wolinsky S, Grossman Z, Dybul M, Oxenius A, Price DA, Connors M, Koup RA. HIV preferentially infects HIV-specific CD4+ T cells. Nature. 2002 May 2;417:95–98. - PubMed
    1. Borrow P, Lewicki H, Hahn BH, Shaw GM, Oldstone MB. Virus-specific CD8+ cytotoxic T-lymphocyte activity associated with control of viremia in primary human immunodeficiency virus type 1 infection. Journal of Virology. 1994 Sep;68:6103–6110. - PMC - PubMed
    1. Koup RA, Safrit JT, Cao Y, Andrews CA, McLeod G, Borkowsky W, Farthing C, Ho DD. Temporal association of cellular immune responses with the initial control of viremia in primary human immunodeficiency virus type 1 syndrome. Journal of Virology. 1994 Jul;68:4650–4655. - PMC - PubMed
    1. Mellors JW, Rinaldo CR, Jr, Gupta P, White RM, Todd JA, Kingsley LA. Prognosis in HIV-1 infection predicted by the quantity of virus in plasma. Science. 1996 May 24;272:1167–1170. - PubMed
    1. Lyles RH, Munoz A, Yamashita TE, Bazmi H, Detels R, Rinaldo CR, Margolick JB, Phair JP, Mellors JW. Natural history of human immunodeficiency virus type 1 viremia after seroconversion and proximal to AIDS in a large cohort of homosexual men. Multicenter AIDS Cohort Study. The Journal of infectious diseases. 2000 Mar;181:872–880. - PubMed

Publication types

MeSH terms