. 2011 Mar;37(2):189-212.
doi: 10.1007/s10867-010-9207-3. Epub 2010 Nov 20.

Responses of recurrent nets of asymmetric ON and OFF cells

Responses of recurrent nets of asymmetric ON and OFF cells

Jérémie Lefebvre et al. J Biol Phys. 2011 Mar.

Abstract

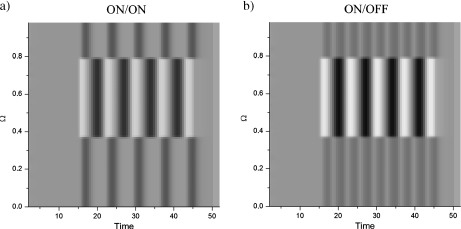
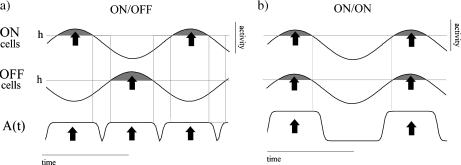
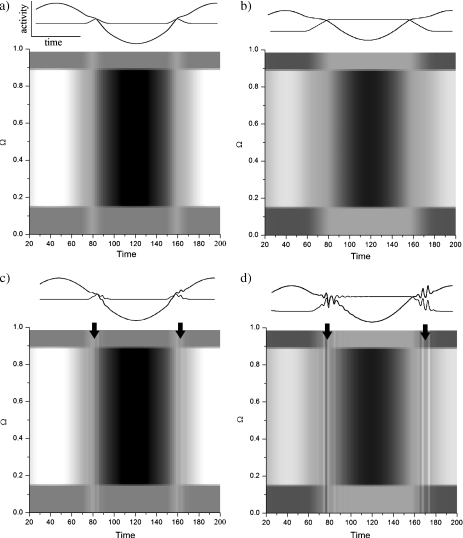
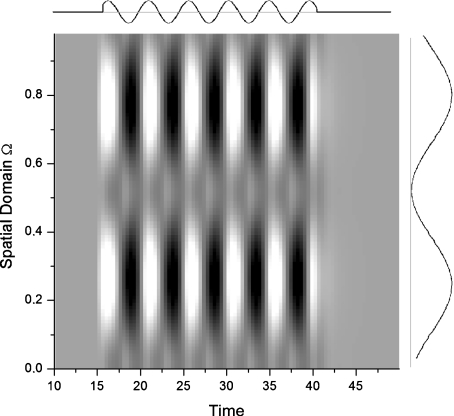
A neural field model of ON and OFF cells with all-to-all inhibitory feedback is investigated. External spatiotemporal stimuli drive the ON and OFF cells with, respectively, direct and inverted polarity. The dynamic differences between networks built of ON and OFF cells ("ON/OFF") and those having only ON cells ("ON/ON") are described for the general case where ON and OFF cells can have different spontaneous firing rates; this asymmetric case is generic. Neural responses to nonhomogeneous static and time-periodic inputs are analyzed in regimes close to and away from self-oscillation. Static stimuli can cause oscillatory behavior for certain asymmetry levels. Time-periodic stimuli expose dynamical differences between ON/OFF and ON/ON nets. Outside the stimulated region, we show that ON/OFF nets exhibit frequency doubling, while ON/ON nets cannot. On the other hand, ON/ON networks show antiphase responses between stimulated and unstimulated regions, an effect that does not rely on specific receptive field circuitry. An analysis of the resonance properties of both net types reveals that ON/OFF nets exhibit larger response amplitude. Numerical simulations of the neural field models agree with theoretical predictions for localized static and time-periodic forcing. This is also the case for simulations of a network of noisy integrate-and-fire neurons. We finally discuss the application of the model to the electrosensory system and to frequency-doubling effects in retina.

Keywords: Bifurcations; Delayed feedback; ON and OFF cells; Recurrent connections.


Figures

Fig. 1
Fig. 1
Schematic of the driven ON/OFF network. The spatial extent of the network is shown vertically, while the mean somatic membrane potential, or activity, across the domain is drawn horizontally. The system is composed of a layer of intercalated ON and OFF pyramidal cells. As an example, here OFF cells (right) have a higher activity level than ON cells (left). When the input I(x,t) increases and is applied to both cell types, ON cells become more excited, and OFF cells have a reduced activity. All activities are summed (Σ) across the network and sent back to the pyramidal cell layer with all-to-all delayed feedback coupling. Lateral connections between neural sites are considered weak and negligible
Fig. 2
Fig. 2
Localized pulse generating oscillatory activity in an ON/OFF network for both the neural field and integrate-and-fire descriptions. The activity of ON cells is shown on the left and of the OFF cells on the right. As the input is turned on, the activity of stimulated ON (resp. OFF) cells increases (resp. decreases); the resulting change in the feedback causes a bifurcation. The neural field model (a, b) shows the ON and OFF populations reaching a stable limit cycle after a short transient. The global oscillations in the LIF model (c, d), shown in the lower panels, take the form of periodic firing rate modulations. Parameters are Io = 0.5, Vo = 0.0, Δ = 0.8, h = 0.25, and τ = 0.8 for the neural field description. The LIF model parameters are Io = 1.9, h = 1, μ = 0.4, g = − 0.07, D = 2.0 for formula image cells with Gaussian white noise; parameters have been scaled to closely match the response frequency in the neural field case. The input has an amplitude Io and a width of Δ = 0.8 for t > 15. Throughout the paper, we set α = 1, β = 25, and Ω = [0, 1]. Time in the panels is dimensionless. However, we may scale the time axis such that 1 time unit = 10 msec, as the physiologically measured delay range suggests. In this case, the oscillation frequency is close to 50 Hz, and corresponds to the range of frequencies measured in the electrosensory system
Fig. 3
Fig. 3
Regions in the (τ,h) subspace of parameter space where global oscillations are stable for I(x,t) = 0 and various asymmetry levels (adapted from [20]). For Vo = 0 (black-shaded region), ON and OFF populations share the same spontaneous firing rates and thus have the same activity relative to the feedback threshold. The resulting Andronov–Hopf region has the shape of a parabola, as in an ON/ON system. If Vo is increased to 0.2 (gray-shaded region), the stable domain starts to split into two distinct regions, showing that ON and OFF populations do not have the same activity level with respect to the threshold of the system and thus that their relative Andronov–Hopf domains (where cyclic solutions becomes stable) are becoming distinct. The separation becomes even more appreciable with respect to initial case when Vo reaches the value of 0.4 (dark gray-shaded region) as indicated by the black arrows. Parameters are as in Fig. 2 with I(x,t) = 0
Fig. 4
Fig. 4
a Regions in (Io, Vo) space where oscillatory response occurs, for ON/ON (dark gray) and ON/OFF (light gray) network configurations. These points are such that R > Rc in each case. For small asymmetry values, the ON/OFF configuration can respond to both excitatory and inhibitory inputs, the oscillatory response region being symmetrical with respect to the vertical line Io = 0. ON/OFF nets can oscillate for both positive and negative inputs. ON/ON nets have a larger interval of Io values that cause oscillation compared to ON/OFF nets. An ON/ON net can oscillate in response to both positive and negative inputs only if Vo is large. b Slice of the graph shown in a for Vo = 0.0, illustrating how the parameter R in (6) changes as a function of Io. Shaded areas correspond to the parameter sets such that R > Rc. c For larger asymmetry Vo = 0.2, an ON/OFF net now has a larger range of inputs that cause oscillations, and ON/ON nets now show two distinct intervals of input amplitudes. Parameters are Rc ≈ 1.83, τ = 1.4, Δ = 0.6, h = 0.1
Fig. 5
Fig. 5
Central and lateral responses to a spatially localized pulse of amplitude Io and width Δ = |x1 − x2| far from the Andronov–Hopf regime, for both ON/OFF and ON/ON network configurations. ON/OFF net lateral response is nonmonotonic, while it is not so in the ON/ON case. a Local regions correspond to the neural sites located inside the pulse, i.e., for x ∈ [x1,x2], which are directly stimulated. Lateral sites do not receive the input but are driven only by the feedback. b The activity differences between stimulated and nonstimulated states are plotted versus Io. The central response is monotonic for both configurations, although two slopes distinguish the curves. c Lateral responses are radically different for ON/ON and ON/OFF nets. The ON/OFF response to the pulse is nonmonotonic as a function of pulse height Io, while the ON/ON response is monotonically decreasing. The difference between the curves in b and c is Io in both cases. Parameters are Vo = 0.3, h = 0.05, τ = 0.2
Fig. 6
Fig. 6
ON cell response to a sinusoidally modulated localized pulse. a The ON/ON response is characterized by a central response in phase with the input, while the lateral response is antiphasic with respect to the central response. b The ON/OFF response exhibits a lateral frequency-doubling effect, where the activity oscillates at twice the input frequency, while centrally the activity is in phase with the input and oscillates at the driving frequency. Furthermore, the amplitude of the central response is higher than in the ON/ON case. Parameters are Ω = 1, τ = 0.3, h = 0.0, Io = 0.5 for x ∈ [0.35, 0.75] and t > 15, wo = 0.9, Vo = 0.05
Fig. 7
Fig. 7
Sinusoidally modulated localized pulse generating a lateral frequency-doubling effect in an ON/OFF net. ON and OFF population responses are presented, for both neural field (a, b) and spiking (c, d) approaches. The parameters for the neural field description are identical as in Fig. 6 while for the LIF description, these are τ = 0.3, h = 1, Io = 5.5, μ = 1.05, Vo = 0.05, and g = − 0.06 for Gaussian white noise
Fig. 8
Fig. 8
Schematic representation of the time evolution of the activity of cells in ON/OFF and ON/ON nets. a As the activity of either ON or OFF cells increases beyond the threshold h (shaded areas), the amplitude of the feedback increases. In ON/OFF nets, stimulated ON and OFF cells never activate the feedback simultaneously; the resulting recurrent signals oscillate at twice the input frequency. b Stimulated cells in an ON/ON net activate the feedback simultaneously, which then oscillates with the same frequency as the input. The profile of the feedback term A(t) as in (2) is also shown in the two cases
Fig. 9
Fig. 9
ON cell responses to a time-periodic stimulus in ON/OFF and ON/ON nets, far from (a, b) and close (c, d) to the Andronov–Hopf regime. Andronov–Hopf cycles appear whenever ON or OFF cell activity is near the feedback threshold h, making the parameter R cross the critical value Rc. A small frequency of wo = 0.04 allows those cycles to gain sufficient amplitude to be seen. The ON/OFF net is shown on the left (a, c) and ON/ON on the right (b, d). On the top of each panel, bold lines describe the central temporal evolution of the solutions, while thin lines describe lateral dynamics. Other parameters are Ω = 1, Io = 1.1 for x ∈ [0.15,0.85] and 0 elsewhere, Vo = 0.05 and h = 0.0. The delay chosen in the fixed point regime is τ = 0.5 while τ = 1.8 near the Andronov–Hopf regime
Fig. 10
Fig. 10
Response amplitude discrepancy of central ON cells in ON/ON and ON/OFF networks. a Evolution of the activity of sinusoidally driven ON cells, for central locations, i.e., xi ∈ Δ. Activity oscillations in an ON/OFF network (solid line) are larger than in an ON/ON network (dashed line). b Resulting evolution of the feedback A(t) according to a sinusoidal stimulus, in the ON/ON and ON/OFF cases. In the ON/ON case, the sudden activation of the feedback caused by the two populations is such that A(t) makes high amplitude excursions away from the resting value, resulting in a strong inhibitory effect on the network. This decreases the amplitude of the response, but only when the amplitude of the input is positive. In the ON/OFF case, the simultaneous and antiphase responses of ON and OFF cells result in a full-wave rectification across the feedback loop. The variations of the feedback amplitude are much smaller, meaning that less inhibition affects the response at the sensory layer. Further, the activation of the negative feedback by the OFF cells during the negative components of the input results in an amplification of the response. The input temporal structure is plotted in c. Parameters are Ω = 1, τ = 0.3, h = 0.0, Io = 0.5 for x ∈ [0.35, 0.75] and t > 15, wo = 0.9, Vo = 0.05
Fig. 11
Fig. 11
Response amplitude of central ON cells in ON/ON and ON/OFF nets as a function of input frequency. A sinusoidally modulated pulse of fixed amplitude Io = 0.25 and width Δ = 0.4 generates distinct frequency tuning properties if the system incorporates OFF cells. a For τ = 0, ON/ON net response is relatively constant over the range of frequencies considered. The units recruit the feedback pathway, which in turn reduces the amplitude of the cells’ response. For τ = 0.9, the curve shows the resonance due to the Andronov–Hopf frequency. The response amplitude diminishes as the frequency becomes larger because the input becomes too fast compared to the system’s dynamics. b In ON/OFF nets, the response curve is lowpass. For τ = 0, the response is maximal at low frequencies due to the feedback amplification, whereas the amplitude is larger compared to the case shown in a. Increasing the delay to τ = 0.9 makes the system closer to the Andronov–Hopf regime: a resonant peak becomes visible near the Hopf frequency
Fig. 12
Fig. 12
Frequency doubling caused by a spatially and temporally sinusoidal input, mimicking an illumination grating stimulus. This input is presented here to a one-dimensional retina. Parameters are Ω = 1, τ = 0.4, h = 0.0, Io = 0.5, wo = 1.3, Vo = 0.05, and γ = 13.0

Similar articles

Cited by

References

    1. Crook SM, et al. The role of axonal delay in the synchronization of networks of coupled cortical oscillators J. Comput. Neurosci. 19974161–172.0893.9200410.1023/A:1008843412952 - DOI - PubMed
    1. Ermentrout GB, Kopell N.Fine structure of neural spiking and synchronization in the presence of conduction delays Proc. Natl. Acad. Sci. U. S. A. 1998951259–1264.1998PNAS...95.1259E10.1073/pnas.95.3.1259 - DOI - PMC - PubMed
    1. Roxin A, et al. The role of delays in shaping spatio-temporal dynamics of neuronal activity in large networks Phys. Rev. Lett. 2005942381032005PhRvL..94w8103R10.1103/PhysRevLett.94.238103 - DOI - PubMed
    1. Campbell SA, et al. Limit cycles, tori and complex dynamics in a second-order differential equation with delayed negative feedback J. Dyn. Diff. Equ. 199572130816.3404810.1007/BF02218819 - DOI
    1. Dhamala M, Jirsa VK, Ding M. Enhancement of neural synchrony by time delay. Phys. Rev. Lett. 2004;82:74104. doi: 10.1103/PhysRevLett.92.074104. - DOI - PubMed

LinkOut - more resources