

Heart rate variability can be used to estimate sleepiness-related decrements in psychomotor vigilance during total sleep deprivation
- PMID: 22379238
- PMCID: PMC3274333
- DOI: 10.5665/sleep.1688
Heart rate variability can be used to estimate sleepiness-related decrements in psychomotor vigilance during total sleep deprivation
Abstract
Study objectives: To assess whether changes in psychomotor vigilance during sleep deprivation can be estimated using heart rate variability (HRV).
Design: HRV, ocular, and electroencephalogram (EEG) measures were compared for their ability to predict lapses on the Psychomotor Vigilance Task (PVT).
Setting: Chronobiology and Sleep Laboratory, Duke-NUS Graduate Medical School Singapore.
Participants: Twenty-four healthy Chinese men (mean age ± SD = 25.9 ± 2.8 years).
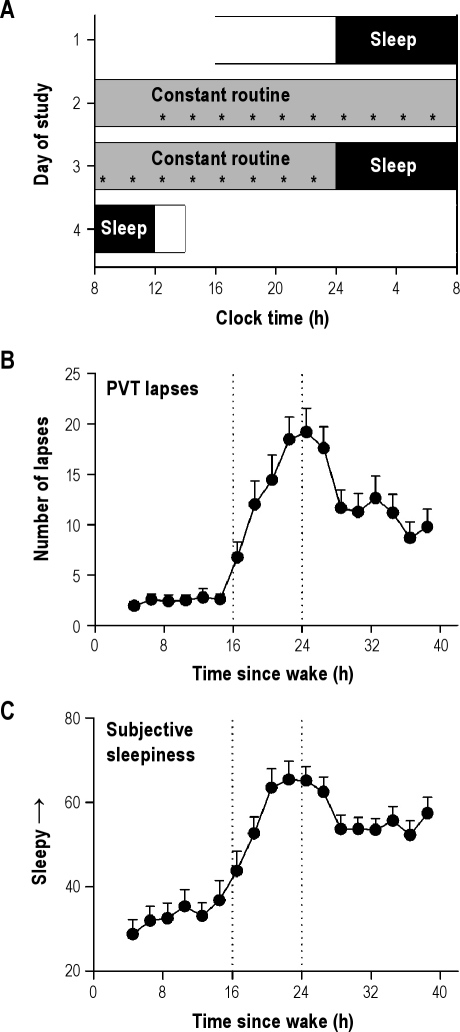
Interventions: Subjects were kept awake continuously for 40 hours under constant environmental conditions. Every 2 hours, subjects completed a 10-minute PVT to assess their ability to sustain visual attention.
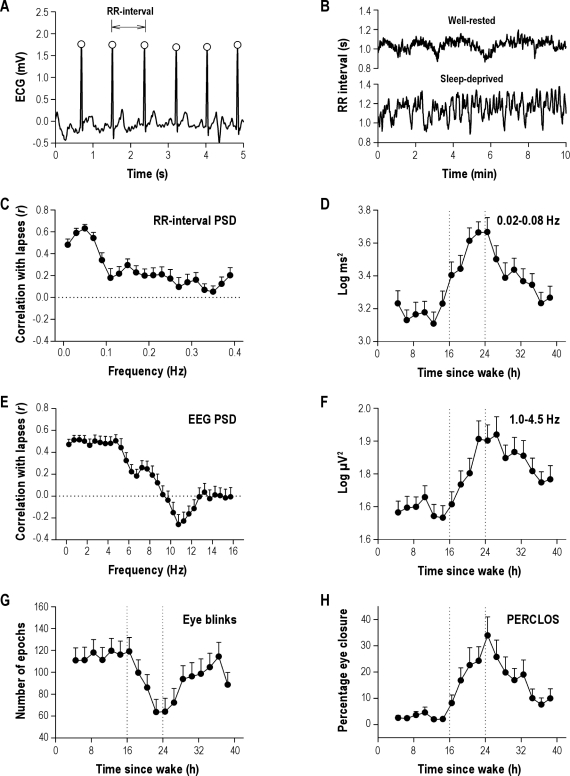
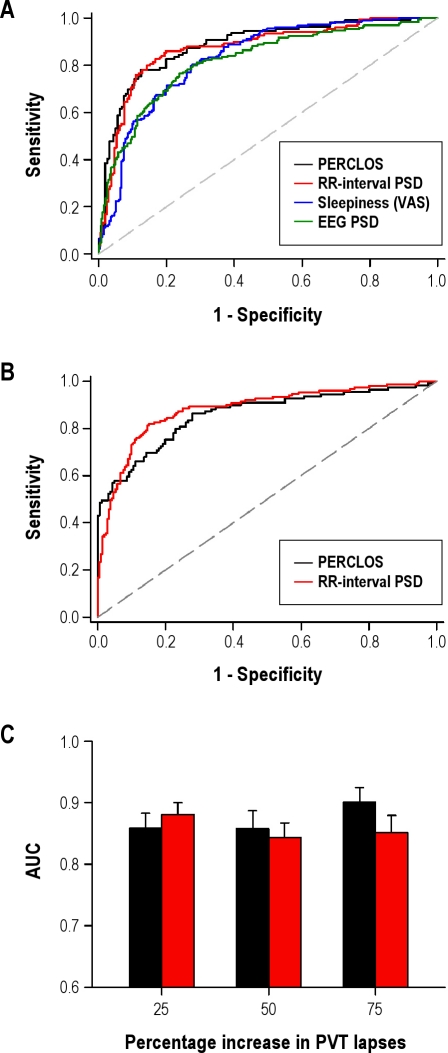
Measurements and results: During each PVT, we examined the electrocardiogram (ECG), EEG, and percentage of time that the eyes were closed (PERCLOS). Similar to EEG power density and PERCLOS measures, the time course of ECG RR-interval power density in the 0.02-0.08-Hz range correlated with the 40-hour profile of PVT lapses. Based on receiver operating characteristic curves, RR-interval power density performed as well as EEG power density at identifying a sleepiness-related increase in PVT lapses above threshold. RR-interval power density (0.02-0.08 Hz) also classified subject performance with sensitivity and specificity similar to that of PERCLOS.
Conclusions: The ECG carries information about a person's vigilance state. Hence, HRV measures could potentially be used to predict when an individual is at increased risk of attentional failure. Our results suggest that HRV monitoring, either alone or in combination with other physiologic measures, could be incorporated into safety devices to warn drowsy operators when their performance is impaired.
Keywords: ECG; EEG; HRV; PERCLOS; PVT; Sleepiness; heart rate.
Figures
Comment in
-
Heart rate variability measures add a new dimension to the understanding of sleepiness.Sleep. 2012 Mar 1;35(3):307-8. doi: 10.5665/sleep.1678. Sleep. 2012. PMID: 22379233 Free PMC article. No abstract available.
References
-
- Lyznicki JM, Doege TC, Davis RM, Williams MA. Sleepiness, driving, and motor vehicle crashes. Council on Scientific Affairs, American Medical Association. JAMA. 1998;279:1908–13. - PubMed
-
- Leger D. The cost of sleep-related accidents: a report for the National Commission on Sleep Disorders Research. Sleep. 1994;17:84–93. - PubMed
-
- Lim J, Dinges DF. Sleep deprivation and vigilant attention. Ann N Y Acad Sci. 2008;1129:305–22. - PubMed
-
- Williamson A, Lombardi DA, Folkard S, Stutts J, Courtney TK, Connor JL. The link between fatigue and safety. Accid Anal Prev. 2011;43:498–515. - PubMed
-
- Dawson D, Reid K. Fatigue, alcohol and performance impairment. Nature. 1997;388:235. - PubMed
Publication types
MeSH terms
LinkOut - more resources
Full Text Sources
Medical
