. 2012 Mar 1;35(3):335-44.
doi: 10.5665/sleep.1690.

The BDNF Val66Met polymorphism modulates sleep intensity: EEG frequency- and state-specificity

Affiliations

The BDNF Val66Met polymorphism modulates sleep intensity: EEG frequency- and state-specificity

Valérie Bachmann et al. Sleep. .

Abstract

Study objectives: EEG slow waves are the hallmark of deep NREM sleep and may reflect the restorative functions of sleep. Evidence suggests that increased sleep slow waves after sleep deprivation reflect plastic synaptic processes, and that brain-derived neurotrophic factor (BDNF) is causally involved in their homeostatic regulation. The functional Val66Met polymorphism of the gene encoding pro-BDNF causes impaired activity-dependent secretion of mature BDNF protein. We investigated whether this polymorphism contributes to the pronounced inter-individual variation in sleep slow wave activity (SWA) in humans.

Setting: Sleep laboratory in temporal isolation unit.

Participants: Eleven heterozygous Met allele carriers and 11 individually sex- and age-matched Val/Val homozygotes.

Interventions: Forty hours prolonged wakefulness.

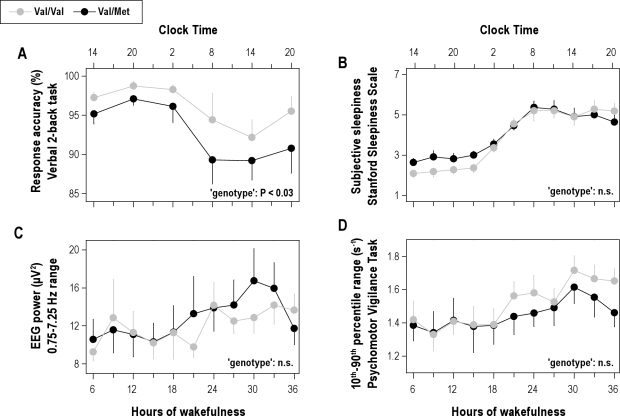
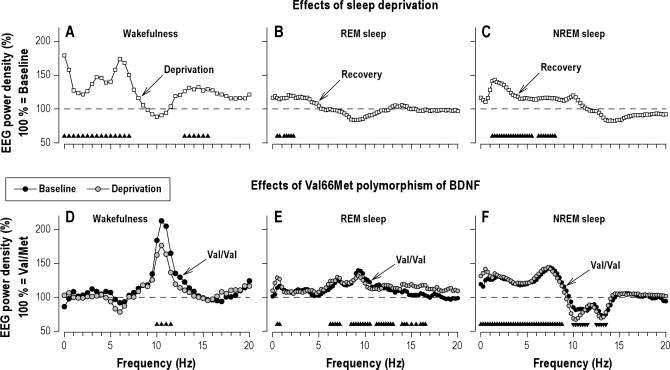
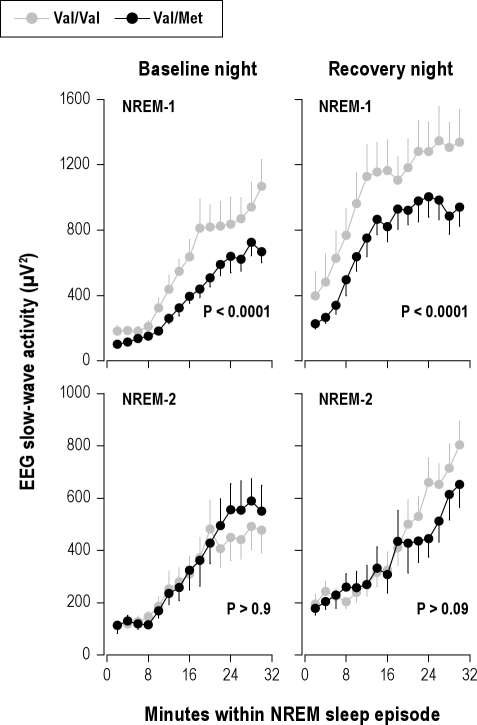
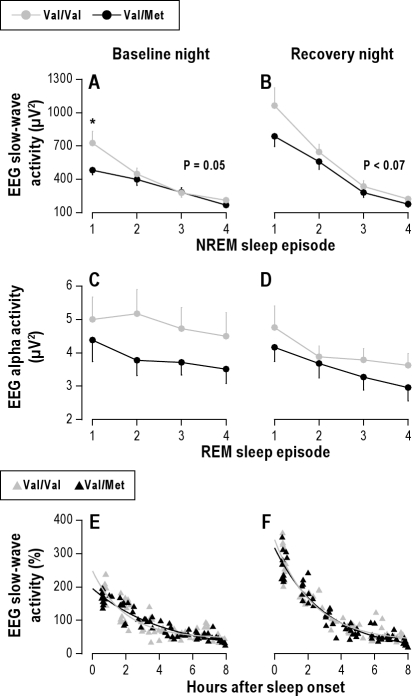
Measurements and results: Cognitive performance, subjective state, and waking and sleep EEG in baseline and after sleep deprivation were studied. Val/Val homozygotes showed better response accuracy than Met allele carriers on a verbal 2-back working memory task. This difference did not reflect genotype-dependent differences in sleepiness, well-being, or sustained attention. In baseline and recovery nights, deep stage 4 sleep and NREM sleep intensity as quantified by EEG SWA (0.75-4.5 Hz) were higher in Val/Val compared to Val/Met genotype. Similar to sleep deprivation, the difference was most pronounced in the first NREM sleep episode. By contrast, increased activity in higher EEG frequencies (> 6 Hz) in wakefulness and REM sleep was distinct from the effects of prolonged wakefulness.

Conclusion: BDNF contributes to the regulation of sleep slow wave oscillations, suggesting that genetically determined variation in neuronal plasticity modulates NREM sleep intensity in humans.

Keywords: Brain derived neurotrophic factor; electroencephalogram; sleep homeostasis; slow wave sleep; synaptic plasticity.


Figures

Figure 1
Figure 1
Better working memory in Val/Val genotype of BDNF. The data were analyzed with 2-way, mixed-model ANOVA with the factors “genotype” (Val/Val, Val/Met) and “session” (6 [2-back] or 11 [sleepiness and PVT] consecutive assessments). (A) Time course of response accuracy (percentage of correct responses) on a visual verbal 2-back task (means ± SEM). Starting after 6.75 h of wakefulness (at 14:45), each subject completed 6 test sessions at 6-h intervals. Tick marks on the x-axes were rounded down to the nearest hour. Val/Val allele carriers (gray dots, n = 11) performed better than Val/Met allele carriers (black dots, n = 11) throughout prolonged wakefulness (genotype: F1,40 = 5.1, P < 0.03; session: F5,41 = 11.8, P < 0.0001; genotype × session: F5,59 = 0.2, P > 0.9). (B) Time course of subjective sleepiness as quantified with the Stanford Sleepiness Scale. Mean scores (± SEM) for consecutive 3-h intervals, starting at 6.25 h of wakefulness (at 14:15) are plotted. Tick marks on the x-axes were rounded down to the nearest hour. Sleep deprivation similarly increased subjective sleepiness in both genotypes (genotype: F1,65 = 1.8, P = 0.1; session: F10,120 = 38.7, P < 0.0001; genotype × session: F10,131 = 0.94, P > 0.4). (C) Time course of EEG 0.75-7.25 Hz power in wakefulness. Mean absolute power values (± SEM) for consecutive 3-h intervals, starting at 6.25 h of wakefulness (at 14:15) are plotted. Tick marks on the x-axes were rounded down to the nearest hour. Sleep deprivation similarly affected EEG power in both genotypes (genotype: F1,45 = 0.4, P > 0.5; session: F10,167 = 15.9, P < 0.001; genotype × session: F10,117 = 0.6, P > 0.8). (D) Time course of global alertness as quantified with the 10th-to-90th inter-percentile range of reaction times on the psychomotor vigilance task. Mean scores (± SEM) for consecutive 3-h intervals, starting at 6.25 h of wakefulness (at 14:15) are plotted. Tick marks on the x-axes were rounded down to the nearest hour. Sleep deprivation induced similar response instability in Val/Val and Val/Met allele carriers of BDNF (genotype: F1,46 = 2.0, P > 0.1; session: F10,160 = 7.1, P < 0.0001; genotype × session: F10,114 = 0.3, P > 0.9).
Figure 2
Figure 2
Sleep deprivation and BDNF genotype modulate EEG oscillations in vigilance/sleep state-specific manner. Effects of sleep deprivation (A-C): To quantify the effects of sleep deprivation on the waking EEG (C3A2 derivation, eyes open), absolute EEG power values were averaged over 4 recording sessions (08:00, 11:00, 14:00, 17:00) after sleep loss (day 2, deprivation) and compared to the corresponding values in baseline (day 1). In REM sleep and NREM sleep, EEG activity in the recovery night was expressed as a percentage of the corresponding values in the baseline night (horizontal dashed lines at 100%). Geometric mean values were plotted for each 0.5-Hz bin in wakefulness, and for each 0.25-Hz bin in REM sleep and NREM sleep (n = 22). Triangles at the bottom of the panels indicate frequency bins, which differed significantly from baseline (condition: F1,30 ≥ 4.2, P < 0.05). Effects of the Val66Met polymorphism of BDNF (D-F): Absolute power values in individuals with Val/Val genotype (n = 11) were expressed as a percentage of the corresponding value of individuals with Val/Met genotype (n = 11; horizontal dashed lines at 100%). Wakefulness: Relative EEG power spectra in recording sessions at 8:00, 11:00, 14:00, and 17:00 on day 1 (baseline) and day 2 (deprivation). REM sleep and NREM sleep: Relative EEG power spectra in baseline and recovery nights. Geometric mean values were plotted for each 0.5-Hz bin in wakefulness, and for each 0.25-Hz bin in REM sleep and NREM sleep. Triangles at the bottom of the panels indicate frequency bins, in which power differed significantly between Val/Val and Val/Met genotypes (genotype: F1,30 ≥ 4.3, P < 0.05).
Figure 3
Figure 3
Steeper build-up of initial slow-wave activity (SWA) in NREM sleep in Val/Val genotype of BDNF. Absolute EEG SWA (0.75-4.5 Hz; means ± SEM) values of consecutive 2-min epochs during the first 30 min of NREM sleep episodes 1 and 2 in baseline and recovery nights were plotted for Val/Val (gray dots, n = 11) and Val/Met (black dots, n = 11) genotypes. Data were analyzed with 4-way, mixed-model ANOVA with the within-subjects factors “genotype” (Val/Val, Val/Met), “condition” (baseline, recovery), “NREM sleep episode” (1, 2), and “2-min epoch” (1-15). SWA was significantly higher in Val/Val allele carriers than in Val/Met allele carriers (genotype: F1,91 = 9.3, P = 0.003), and the difference between the genotypes was modulated by NREM sleep episode (genotype × sleep episode: F1,148 = 6.1, P = 0.01). Separate analyses of NREM sleep episodes 1 and 2 revealed that the difference was restricted to NREM-1 (genotype: baseline, F1,56.4 = 37.7, P < 0.0001; recovery, F1,47.4 = 19.2, P < 0.0001) and not present in NREM-2 (baseline, F1,50 = 0.0, P > 0.9; recovery, F1,52 = 2.9, P > 0.09). To estimate the rise rates of SWA in Val/Val and Val/Met genotypes, the median slopes of adjacent 2-min intervals in the first 30 minutes of NREM sleep episodes 1 and 2 were calculated in baseline and recovery nights. The data were analyzed with 3-way, mixed-model ANOVA with the within-subjects factors “genotype” (Val/Val, Val/Met), “NREM sleep episode” (1, 2), and “condition” (baseline, recovery). The build-up rate of SWA was faster in Val/Val genotype than in Val/Met genotype (NREM-1, baseline: 64.3 ± 13.1 vs. 27.2 ± 5.4 μV2/min; NREM-1, recovery: 76.3 ± 14.8 vs. 57.0 ± 14.5 μV2/min; NREM-2, baseline: 29.8 ± 5.4 vs. 17.6 ± 10.0 μV2/min; NREM-2, recovery: 37.5 ± 7.3 vs. 29.3 ± 9.7 μV2/min) (genotype: F1,70 = 3.8, P < 0.06; NREM sleep episode: F1,70 = 13.8, P < 0.001; condition: F1,70 = 3.8, P < 0.06; genotype × NREM sleep episode: F1,70 = 5.2, P < 0.03). Separate analyses of NREM sleep episodes 1 and 2 showed that the difference was present in NREM-1 (genotype: F1,30 = 7.4, P < 0.02), but not in NREM-2 (genotype: F1,30 = 0.1, P > 0.7).
Figure 4
Figure 4
Elevated level and faster dissipation of slow-wave activity (SWA) in Val/Val genotype of BDNF. Mean absolute (± SEM) and individual relative SWA values were plotted for the first 4 NREM sleep episodes (stages 2-4) in baseline and recovery nights (C3A2 derivation). (A & B) Gray dots: Val/Val allele carriers (n = 11). Black dots: Val/Met allele carriers (n = 11). The data were analyzed with 3-way, mixed-model ANOVA with the within-subject factors “genotype” (Val/Val, Val/Met), “NREM sleep episode” (1-4), and “condition” (baseline, recovery). Val/Val genotype subjects exhibited higher SWA than Val/Met genotype subjects (genotype: F1,30 = 7.7, P < 0.01). The difference was largest in NREM sleep episode 1 (genotype × NREM sleep episode × condition: F6,133 = 4.1, P < 0.001). The asterisk indicates the significant difference between Val/Val and Val/Met genotypes (P = 0.01, Tukey HSD test). In both genotypes, SWA decreased across consecutive NREM sleep episodes (NREM sleep episode: F3,124 = 391.2, P < 0.0001) and was enhanced after sleep deprivation (condition: F1,115 = 39.3, P < 0.0001). The P-values refer to the difference between the genotypes in the decline in SWA from the first to the second NREM sleep episode (Tukey HSD tests). (C & D) Time course of EEG alpha activity (8.375-10.625 Hz) in REM sleep. Gray dots: Val/Val allele carriers (n = 11). Black dots: Val/Met allele carriers (n = 11). Three-way mixed model ANOVA with the factors genotype (Val/Val, Val/Met), REM sleep episode (1-4) and condition (baseline, recovery) revealed significant main effects (genotype: F1,27 = 7.0, P < 0.02; REM sleep episode: F3,121 = 13.4, P < 0.0001; night: F1,104 = 16.3, P = 0.0001), yet no significant interactions. (E & F) Individual SWA values per NREM sleep episode in baseline and recovery nights were plotted at episode midpoint times relative to sleep onset. The lines represent exponential decay fits SWAt = SWA + SWAo × e-r*t in Val/Val (gray triangles, gray line) and Val/Met (black triangles, black line) allele carriers (t = time, τ = time constant, SWAo = initial value, and SWA = lower asymptote). The decay rate r of the exponential decay of SWA was estimated across consecutive NREM sleep episodes. Two-way, mixed-model ANOVA showed significant effects of genotype (F1,30 = 8.1, P < 0.01) and genotype × condition interaction (genotype × condition: F1,30 = 4.6, P < 0.05).
Figure 5
Figure 5
Genotype-dependent difference in initial slow-wave activity (SWA) is independent of EEG location. Mean absolute SWA (0.75-4.5 Hz) values (± SEM) in fronto-central (FC), centro-parietal (CP), and parieto-occipital (PO) EEG derivations are plotted for the first 4 NREM sleep episodes in baseline and recovery nights. Gray dots: Val/Val allele carriers (n = 11). Black dots: Val/Met allele carriers (n = 11). Data were analyzed with 4-way, mixed-model ANOVA with the factors genotype (Val/Val, Val/Met), condition (baseline, recovery), NREM sleep episode (1-4) and derivation (FC, CP, PO). Val/Val genotype subjects exhibited higher SWA than Val/Met genotype subjects (genotype: F1,122 = 27.8, P < 0.0001). No interactions involving the factor genotype were found (main effects: condition: F1,209 = 39.0, P < 0.0001; NREM sleep episode: F3,257 = 403.2, P < 0.0001; derivation: F2,377 = 45.7, P < 0.0001). Except for the FC derivation in the recovery night, post hoc Tukey HSD tests indicated a difference between the genotypes in all derivation in NREM sleep episode 1 (P-values).

Comment in

  • Determinants of cortical synchrony.
    Mongrain V, Warby SC. Mongrain V, et al. Sleep. 2012 Mar 1;35(3):309-10. doi: 10.5665/sleep.1680. Sleep. 2012. PMID: 22379234 Free PMC article. No abstract available.

Similar articles

Cited by

References

    1. Achermann P, Borbély AA. Sleep homeostasis and models of sleep regulation. In: Kryger MH, Roth T, Dement WC, editors. Principles and practice of sleep medicine. 5th ed. St. Louis, MI: Elsevier Saunders; 2011. pp. 431–44.
    1. Tononi G, Cirelli C. Sleep function and synaptic homeostasis. Sleep Med Rev. 2006;10:49–62. - PubMed
    1. Lu B. BDNF and activity-dependent synaptic modulation. Learn Mem. 2003;10:86–98. - PMC - PubMed
    1. Waterhouse EG, Xu BJ. New insights into the role of brain-derived neurotrophic factor in synaptic plasticity. Mol Cell Neurosci. 2009;42:81–9. - PMC - PubMed
    1. Korte M, Carroll P, Wolf E, Brem G, Thoenen H, Bonhoeffer T. Hippocampal long-term potentiation is impaired in mice lacking brain-derived neurotrophic factor. Proc Natl Acad Sci U S A. 1995;92:8856–60. - PMC - PubMed

Publication types

Substances