. 2012 Jan;8(1):e1002352.
doi: 10.1371/journal.pcbi.1002352. Epub 2012 Jan 19.

Dynamic modelling under uncertainty: the case of Trypanosoma brucei energy metabolism

Collaborators, Affiliations

Dynamic modelling under uncertainty: the case of Trypanosoma brucei energy metabolism

Fiona Achcar et al. PLoS Comput Biol. 2012 Jan.

Abstract

Kinetic models of metabolism require detailed knowledge of kinetic parameters. However, due to measurement errors or lack of data this knowledge is often uncertain. The model of glycolysis in the parasitic protozoan Trypanosoma brucei is a particularly well analysed example of a quantitative metabolic model, but so far it has been studied with a fixed set of parameters only. Here we evaluate the effect of parameter uncertainty. In order to define probability distributions for each parameter, information about the experimental sources and confidence intervals for all parameters were collected. We created a wiki-based website dedicated to the detailed documentation of this information: the SilicoTryp wiki (http://silicotryp.ibls.gla.ac.uk/wiki/Glycolysis). Using information collected in the wiki, we then assigned probability distributions to all parameters of the model. This allowed us to sample sets of alternative models, accurately representing our degree of uncertainty. Some properties of the model, such as the repartition of the glycolytic flux between the glycerol and pyruvate producing branches, are robust to these uncertainties. However, our analysis also allowed us to identify fragilities of the model leading to the accumulation of 3-phosphoglycerate and/or pyruvate. The analysis of the control coefficients revealed the importance of taking into account the uncertainties about the parameters, as the ranking of the reactions can be greatly affected. This work will now form the basis for a comprehensive Bayesian analysis and extension of the model considering alternative topologies.


Conflict of interest statement

The authors have declared that no competing interests exist.

Figures

Figure 1
Figure 1. Aerobic glycolysis in bloodstream form T. brucei.
Abbreviations: Metabolites: Glc-6-P = Glucose 6-phosphate, Fru-6-P = Fructose 6-phosphate, Fru-1,6-BP = Fructose 1,6-bisphosphate, DHAP = dihydroxyacetone phosphate, GA-3-P = glyceraldehyde 3-phosphate, Gly-3-P = glycerol 3-phosphate, 1,3-BPGA = 1,3-bisphosphoglycerate, 3-PGA = 3-phosphoglycerate, 2-PGA = 2-phosphoglycerate, PEP = phosphoenolpyruvate. Reactions: 1 = transport of glucose across the cytosolic membrane, 2 = transport of glucose across the glycosomal membrane, 3 = hexokinase, 4 = phosphoglucose isomerase, 5 = phosphofructokinase, 6 = aldolase, 7 = triosephosphate isomerase, 8 = glyceraldehyde 3-phosphate dehydrogenase, 9 = phosphoglycerate kinase, 10 = transport of 3-PGA across the glycosomal membrane, 11 = phosphoglycerate mutase, 12 = enolase, 13 = pyruvate kinase, 14 = transport of pyruvate across the cytosolic membrane, 15 = glycerol 3-phosphate dehydrogenase, 16 = glycerol kinase, 17 = DHAP-Gly-3-P antiporter, 18 = glycerol-3-phosphate oxidation, 19 = ATP utilisation, 20 = adenylate kinase.
Figure 2
Figure 2. Example of a page of the SilicoTryp wiki.
Each reaction of the model has its own page. On this page, the rate equation is specified and a table includes all parameters with their detailed source and calculations when necessary.
Figure 3
Figure 3. Steady-state concentration of pyruvate as a function of the concentration of 3-phosphoglycerate at steady-state or t = 300 minutes if steady-state is not reached before.
The contour lines indicate when steady-state was reached (in minutes of simulated time). If steady-state was not reached before, simulations were stopped at 300 minutes (see Methods). When a model did not reach steady-state before 300 minutes, the concentrations of pyruvate and/or 3-phosphoglycerate reached unreasonably high concentrations (black contour lines). Note that the models that do not reach steady-state within 300 minutes because of 3-PGA accumulation will eventually reach steady-state at very high 3-PGA concentrations if the simulations are run much longer. This is not the case for the models that show pyruvate accumulation. Since pyruvate kinase is not product-sensitive in the model, nothing stops the accumulation of pyruvate and steady state is never reached (see supplementary Fig. S1 for example of simulations).
Figure 4
Figure 4. Effect of the uncertainties on the distribution of the glycolytic flux between the production of pyruvate and glycerol.
The glycolytic flux is defined as the sum of the fluxes producing glycerol and pyruvate. The black lines represents the percentage of the glycolytic flux in the pyruvate branch (top) and the glycerol branch (bottom) in the fixed parameter model. The red line is the distribution of the percentage of the glycolytic flux in the collection of models generated from the parameter probability distributions. The division of the flux between the pyruvate branch and the glycerol branch is well conserved. The effect of the uncertainties of the parameters is almost non-existent in anaerobic conditions (simulated by setting the glycerol 3-phosphate oxidase formula image 
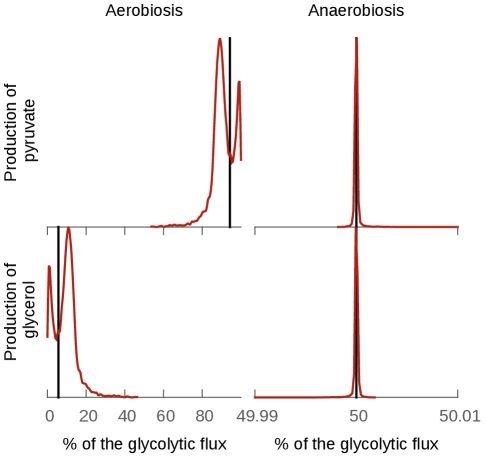
parameter to 0). In aerobic conditions the effect is more important, indicating that this division is not entirely due to the topology of the model in this case.
Figure 5
Figure 5. Distribution of the steady-state concentrations of four metabolites.
The cytosolic 2-phosphoglycerate and glycosomal ATP steady-state concentrations are consistent with physiological metabolite concentration, whereas 3-phosphoglycerate and pyruvate sometimes reach hundreds of millimoles per liter. The value for the fixed parameter model is indicated by a vertical black line.
Figure 6
Figure 6. Percentage of sampled models that reach steady-state within 300 minutes as a function of the of pyruvate transport and phosphoglycerate mutase.
(A) Percentage of models that reach steady-state within 300 minutes as a function of phosphoglycerate mutase formula image 
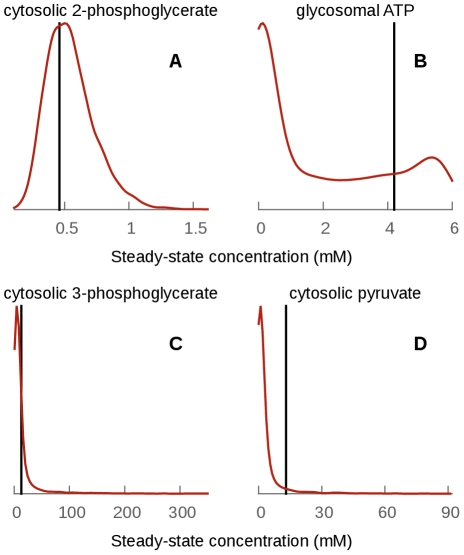
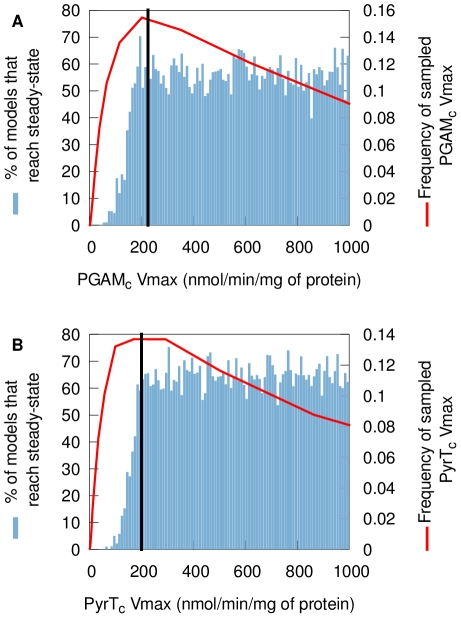
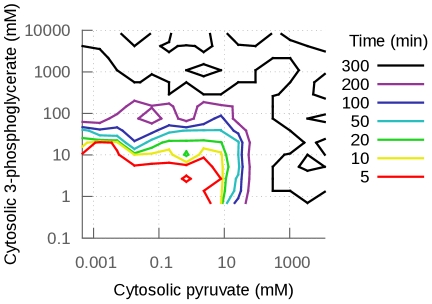
(B) Percentage of models that reach steady-state within 300 minutes as a function of pyruvate transport formula image. The red line is the distribution of the parameter as it is usually sampled. The black line is the fixed-parameter value. A model which has a value for one of these two parameters smaller than the mean will easily fail to reach steady-state, whatever the other parameter values and despite these formula image values still being close to their mean. This reveals fragilities in the model.
Figure 7
Figure 7. Control coefficients in the collection of models.
(A) Percentage of models which have either the glucose transporter (GlcTc), phosphoglycerate mutase (PGAM) or glyceraldehyde 3-phosphate dehydrogenase (GAPDH) as the reaction with the highest control coefficient either over the glucose consumption flux (red) or the oxygen consumption flux (blue). (B) Percentage of models vs. the number of reactions that have a control coefficient higher than 0.001. The color inside the bars represents the proportion that has either the glucose transporter, PGAM or GAPDH as the reaction with the highest control coefficient over the glucose consumption flux within these subgroups.
Figure 8
Figure 8. Distribution of the values retrieved from the BRENDA database.
formula image 
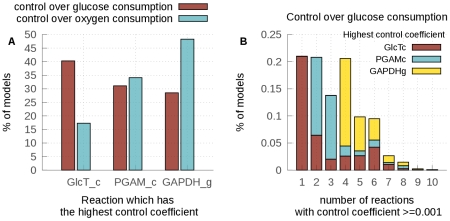
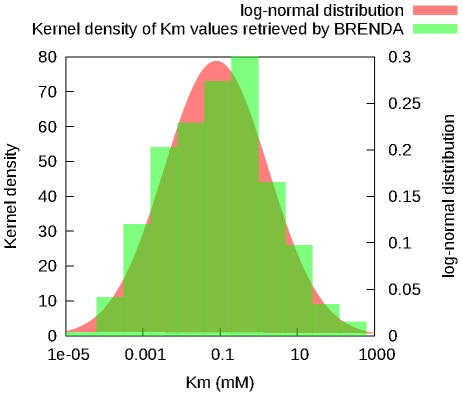
values retrieved from the database (green) and a log-normal distribution with the same mean and standard-deviation (red) are shown.

References

    1. Borger S, Liebermeister W, Klipp E. Prediction of enzyme kinetic parameters based on statistical learning. Genome Inform Ser. 2006;17:80–87. - PubMed
    1. Wang L, Birol I, Hatzimanikatis V. Metabolic control analysis under uncertainty: Framework development and case studies. Biophys J. 2004;87:3750–3763. - PMC - PubMed
    1. Tran LM, Rizk ML, Liao JC. Ensemble modeling of metabolic networks. Biophys J. 2008;95:5606–5617. - PMC - PubMed
    1. Rizk ML, Liao JC. Ensemble modeling and related mathematical modeling of metabolic networks. J Taiwan Inst Chem E. 2009;40:595–601.
    1. Mišković L, Hatzimanikatis V. Modeling of uncertainties in biochemical reactions. Biotechnol Bioeng. 2011;108:413–423. - PubMed

Publication types