. 2012 Mar;60(3):393-403.
doi: 10.1002/glia.22273.

Cthrc1 is a negative regulator of myelination in Schwann cells

Affiliations

Cthrc1 is a negative regulator of myelination in Schwann cells

Caroline Apra et al. Glia. 2012 Mar.

Abstract

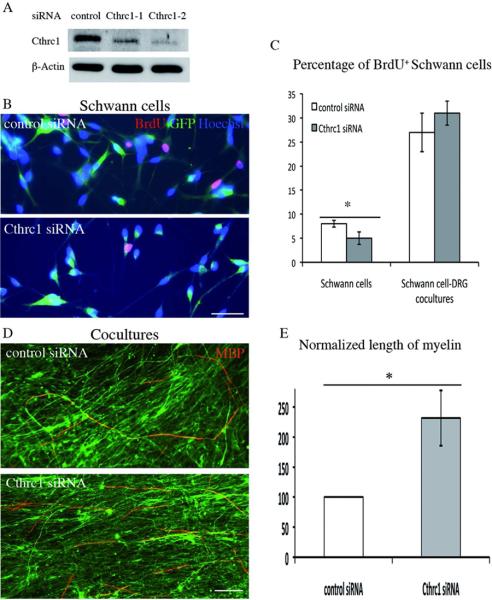
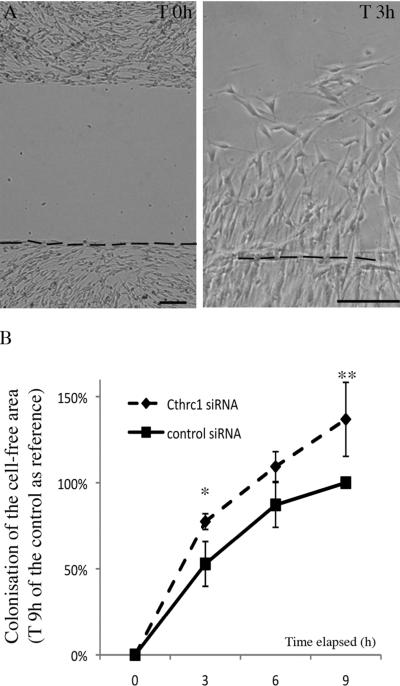
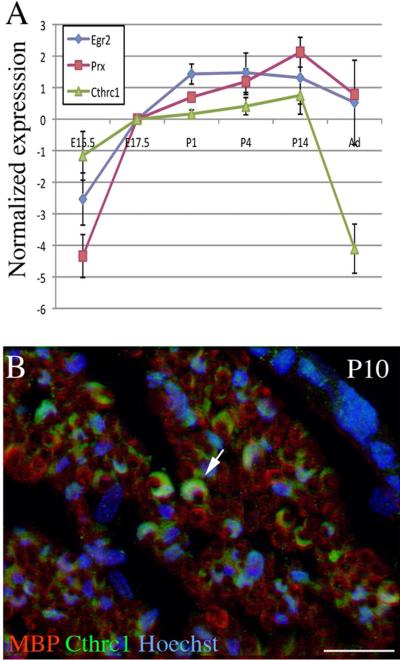
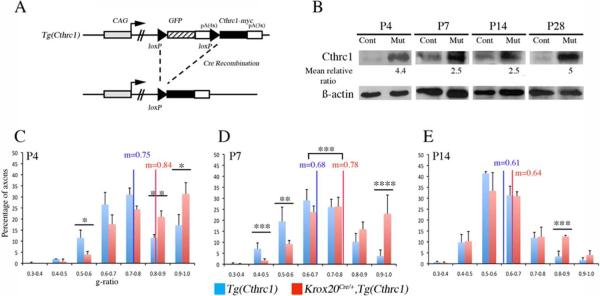
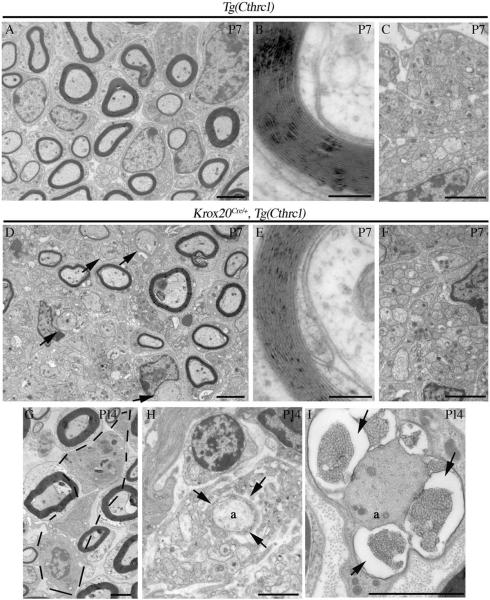
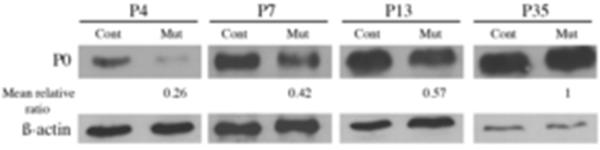
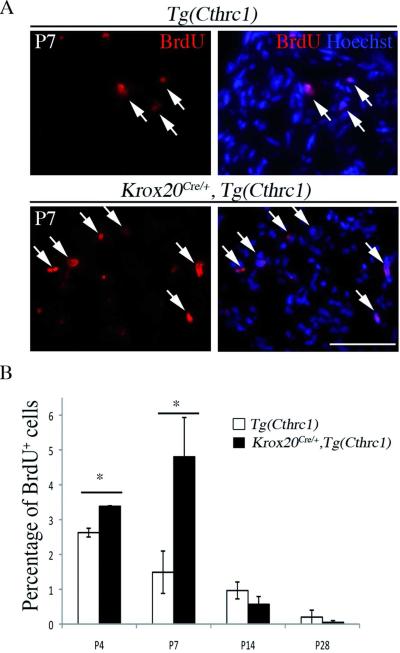
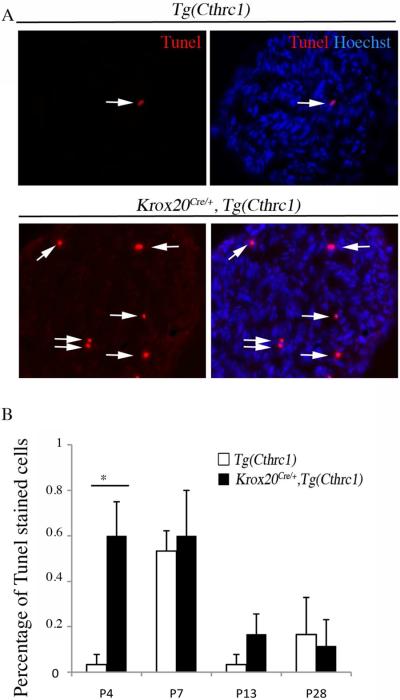
The analysis of the molecular mechanisms involved in the initial interaction between neurons and Schwann cells is a key issue in understanding the myelination process. We recently identified Cthrc1 (Collagen triple helix repeat containing 1) as a gene upregulated in Schwann cells upon interaction with the axon. Cthrc1 encodes a secreted protein previously shown to be involved in migration and proliferation in different cell types. We performed a functional analysis of Cthrc1 in Schwann cells by loss-of- and gain-of-function approaches using RNA interference knockdown in cell culture and a transgenic mouse line that overexpresses the gene. This work establishes that Cthrc1 enhances Schwann cell proliferation but prevents myelination. In particular, time-course analysis of myelin formation intransgenic animals reveals that overexpression of Cthrc1 in Schwann cells leads to a delay in myelin formation with cells maintaining a proliferative state. Our data, therefore, demonstrate that Cthrc1 plays a negative regulatory role, fine-tuning the onset of peripheral myelination.


Figures

Figure 1
Figure 1. Cthrc1 knock-down inhibits Schwann cell proliferation, but promotes myelination
John Wiley & Sons, Inc. A) Western blot analysis of Cthrc1 in protein extracts prepared 3 days after transfection from Schwann cells transfected with control and two Cthrc1 siRNAs as indicated. Control siRNA corresponds to the negative control provided by Ambion (siRNA Negative 1). The level of ß-actin was used as normalization control. B) Cell proliferation was assessed after siRNA transfection by BrdU incorporation, detected by immunocytochemistry (BrdU, red). The cells were co-transfected with a GFP expression vector, with GFP expression shown in green. Nuclei were counterstained with Hoechst (blue). Scale bars: 50 μm. C) Percentage of BrdU-positive nuclei in control or Cthrc1 siRNA-transfected (GFP-positive) Schwann cells. Values are means ± s.e.m of three (culture) and four (co-culture) independent experiments. Statistical significance was analyzed using the Student's t test: *p<0.05. D,E) Myelination potential of siRNA-transfected Schwann cells was estimated by co-culture with DRG neurons. D) Anti-MBP staining (red) shows the presence of myelin in co-cultures of neurons and Schwann cells electroporated with siRNAs as indicated and induced to myelinate with ascorbic acid. Axons were labeled with neurofilament staining (anti-2H3, green). Scale bars: 100 μm. E) Quantification of the myelination data. The total length of myelinated segments was measured in the co-cultures and normalized with the control siRNA. Error bars represent s.e.m from 3 independent experiments. Statistical significance was analyzed using Student's t test: *p<0.001.
Figure 2
Figure 2. Cthrc1 knock-down promotes cell migration
John Wiley & Sons, Inc. A) Illustration of a Schwann cell culture at the time of the creation of the gap (T 0h) and 3 h later (T 3h). The dotted line indicates the initial inferior limit of the gap. Scale bars: 100 μm. B) Quantification of the colonization of the gap by Schwann cells transfected with Cthrc1 or control siRNAs. The covered areas were measured and normalized with the area invaded with control siRNA at T 9 h. Data represent mean ± s.e.m of duplicate cultures from three independent experiments and statistical significance of the difference was analyzed using the Student's t test: p<0.05 at 3 h and p<0.02 at 9 h.
Figure 3
Figure 3. Dynamic Cthrc1 expression in the developing peripheral nerve
John Wiley & Sons, Inc. A) The relative levels of expression of Cthrc1, Krox20 and Prx during peripheral nerve development were estimated by qPCR analysis. The data represent mean values ± s.e.m of the log2 of the relative level of expression of each gene, normalized by its value at E17.5 for 3 independent experiments. B) Transverse sections from P10 mouse sciatic nerves were immunolabeled for MBP (red), and Cthrc1 (green). Cell nuclei were counterstained with Hoechst 33342 (blue). Note the detection of the protein in the cytoplasm (arrow). Scale bar: 30 μm.
Figure 4
Figure 4. Mouse model overexpressing Cthrc1 in Schwann cells
John Wiley & Sons, Inc. A) Schematic representation of the transgene, Tg(Cthrc1). In the original configuration, GFP is expressed from the transgene locus, but not Cthrc1. Cre recombination leads to activation of a myc-tagged version of Cthrc1. pA, polyA. B) Western blotting analysis of protein extracts prepared from sciatic nerves from Tg(Cthrc1) control (Cont) and Krox20Cre/+,Tg(Cthrc1) mutant (Mut) animals at P4, P7, P14, and P28. The ratio of the intensities of the Cthrc1 55 kDa bands between mutant and control, normalized by the level of ß-actin, is indicated below. C–E) Analysis of the distributions and means of g-ratios in Tg(Cthrc1) control and Krox20Cre/+,Tg(Cthrc1) mutant animals at P4 (C), P7 (D) and P14 (E). Only axons with a caliber superior to 1 μm were considered in this analysis. The statistical significance was analyzed using the Student's t test: *p<0.05; **p<0.02; ***p<0.01. Four animals were analyzed at each time point, excepted at P4 were only 2 controls were analyzed. Error bars indicate s.e.m.
Figure 5
Figure 5. Cthrc1 overexpression in Schwann cells delays myelination
John Wiley & Sons, Inc. Electron microscopy analysis of control Tg(Cthrc1) (A–C) and Krox20Cre/+,Tg(Cthrc1) (D–I) sciatic nerves analyzed at P7 (A–F) and P14 (G–I). At P7, Cthrc1 overexpressing animals show a higher number of completely denuded axons (D, arrows) as compared with controls (A, arrows). The compaction of the myelin appears normal (B,E) as well as the organization of the non-myelinating fibers (C,F). At P14, macrophage infiltration (G, indicated area), myelin disruption around the axon (H, arrows), and vesicular modifications of the myelin (I, arrows) are occasionally found in Krox20Cre/+,Tg(Cthrc1) mutants, and never observed in control animals. Scale bars: 2 μm in (A,C,D,F–I), 0.2 μm in (B,E).
Figure 6
Figure 6. Cthrc1 overexpression delays P0 expression
John Wiley & Sons, Inc. B) Western blotting analysis of protein extracts prepared from sciatic nerves from Tg(Cthrc1) control (Cont) and Krox20Cre/+,Tg(Cthrc1) mutant (Mut) animals at P4, P7, P13, and P35. The ratio of the intensities of P0 bands between mutant and control, normalized by the level of ß-actin, is indicated below.
Figure 7
Figure 7. Cthrc1 overexpression leads to increased cell proliferation
John Wiley & Sons, Inc. Cell proliferation was estimated by BrdU incorporation. The animals were intraperitoneally injected with BrdU, whose incorporation into DNA was detected by immunostaining of sciatic nerve sections. A) The micrographs show BrdU staining (red) alone or combined with nuclei counterstaining using Hoechst 33342 (blue) on sciatic nerve sections from Tg(Cthrc1) control or Krox20Cre/+,Tg(Cthrc1) mutant mice at P7. Arrows point to double-labeled cells. B) Quantification of the cell proliferation assay. Note that cell proliferation is enhanced at P4 and P7 in Krox20Cre/+,Tg(Cthrc1) mutant compared to control animals. Values are means ± s.e.m. of three animals. Statistical significance was assessed using the Student's t test: *p<0.01. Scale bars: 50 μm.
Figure 8
Figure 8. The majority of proliferating cells in P7 Cthrc1-overexpressing animals are Schwann cells
John Wiley & Sons, Inc. Schwann cell proliferation was estimated on sciatic nerve sections from Krox20cre+/−,Tg(Cthrc1) mutant mice at P7 by double labelling with a Schwann cell marker (Oct6, green) and a mitosis marker (phospho-histone3, pH3, red), combined with nuclei counterstaining using Hoechst 33342 (blue). A–B) Field showing that the large majority of the proliferating cells are Oct6-positive (arrows). The insets show higher magnification of the areas indicated by dotted lines. C–D) Field showing an Oct6-negative proliferating cell presenting a large nucleus (arrowhead) among several Oct6-positive proliferating cells (arrows). Scale bar: 50 μm.
Figure 9
Figure 9. Analysis of cell apoptosis in the sciatic nerve upon Cthrc1 overexpression
John Wiley & Sons, Inc. Tunel staining was combined with nuclei counterstaining using Hoechst 33342 on sciatic nerve sections from control (Tg(Cthrc1)) or mutant (Krox20Cre/+,Tg(Cthrc1)) mice at different stages and the percentage of Tunel-positive nuclei was estimated. A) The micrographs show Tunel staining (red) alone or combined with Hoechst 33342 (blue) on P7 sciatic nerve sections. Arrows point to double-labeled cells. B) Quantification of the Tunel assay. Apoptosis is enhanced at P4 in mutant mice as compared to control animals. Values are means ± s.e.m. of at least 3 mice. Statistical significance was analyzed using the Student's t test: *p<0.001.

Similar articles

Cited by

References

    1. Barisic N, Claeys KG, Sirotkovic-Skerlev M, Lofgren A, Nelis E, De Jonghe P, Timmerman V. Charcot-Marie-Tooth disease: a clinico-genetic confrontation. Ann Hum Genet. 2008;72:416–441. - PubMed
    1. Birchmeier C, Nave KA. Neuregulin-1, a key axonal signal that drives Schwann cell growth and differentiation. Glia. 2008;56:1491–1497. - PubMed
    1. Blugeon C, Le Crom S, Richard L, Vallat JM, Charnay P, Decker L. Dok4 is involved in Schwann cell myelination and axonal interaction in vitro. Glia in press. 2010 - PubMed
    1. Blugeon C, Le Crom S, Richard L, Vallat JM, Charnay P, Decker L. Dok4 is involved in Schwann cell myelination and axonal interaction in vitro. Glia. 2011;59:351–362. - PubMed
    1. Chernousov MA, Rothblum K, Stahl RC, Evans A, Prentiss L, Carey DJ. Glypican-1 and alpha4(V) collagen are required for Schwann cell myelination. J Neurosci. 2006;26:508–517. - PMC - PubMed

Publication types

MeSH terms