. 2012 Mar;39(3):1361-73.
doi: 10.1118/1.3682171.

Liver segmentation in contrast enhanced CT data using graph cuts and interactive 3D segmentation refinement methods

Affiliations

Liver segmentation in contrast enhanced CT data using graph cuts and interactive 3D segmentation refinement methods

Reinhard Beichel et al. Med Phys. 2012 Mar.

Abstract

Purpose: Liver segmentation is an important prerequisite for the assessment of liver cancer treatment options like tumor resection, image-guided radiation therapy (IGRT), radiofrequency ablation, etc. The purpose of this work was to evaluate a new approach for liver segmentation.

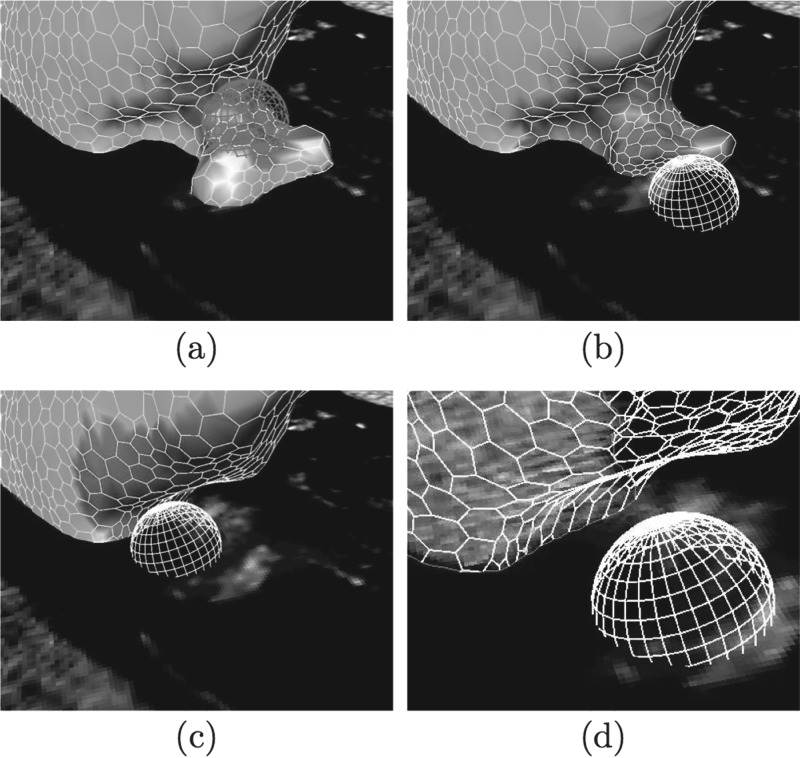
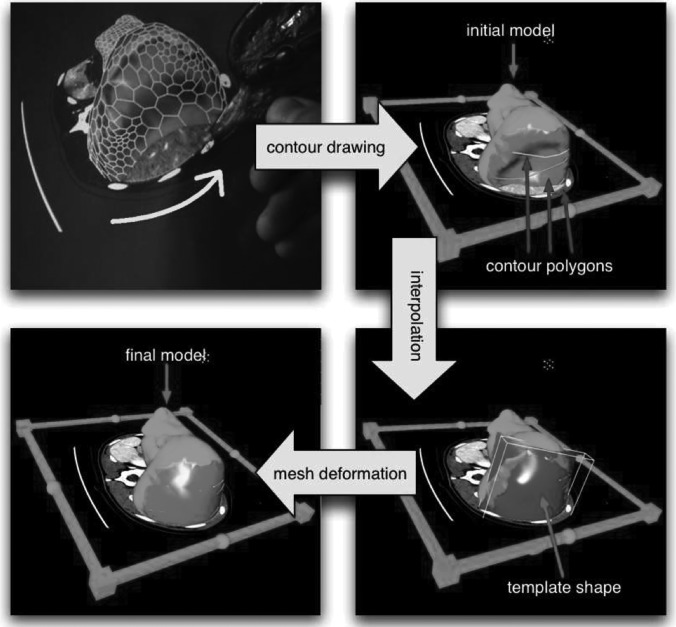
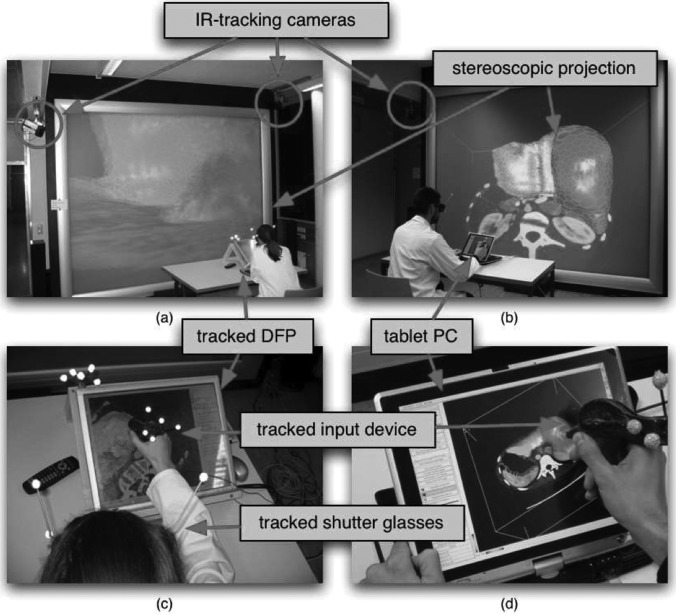
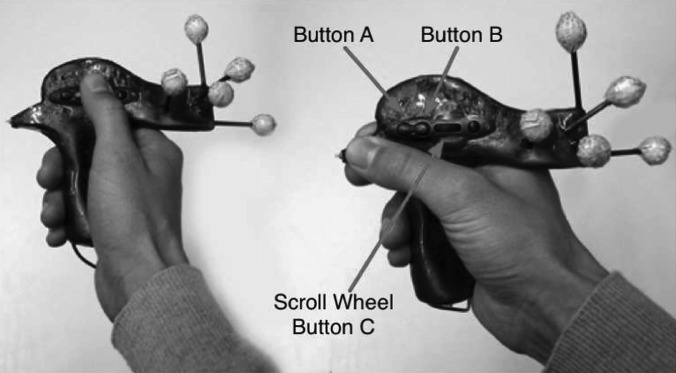
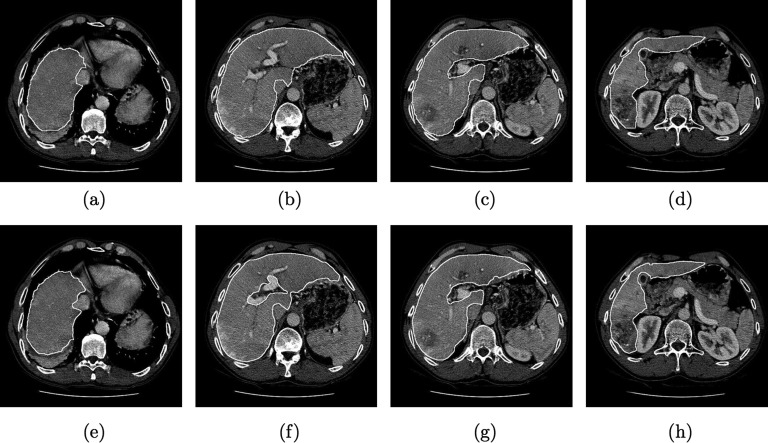
Methods: A graph cuts segmentation method was combined with a three-dimensional virtual reality based segmentation refinement approach. The developed interactive segmentation system allowed the user to manipulate volume chunks and∕or surfaces instead of 2D contours in cross-sectional images (i.e, slice-by-slice). The method was evaluated on twenty routinely acquired portal-phase contrast enhanced multislice computed tomography (CT) data sets. An independent reference was generated by utilizing a currently clinically utilized slice-by-slice segmentation method. After 1 h of introduction to the developed segmentation system, three experts were asked to segment all twenty data sets with the proposed method.

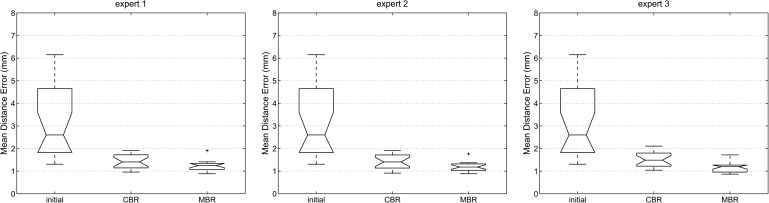
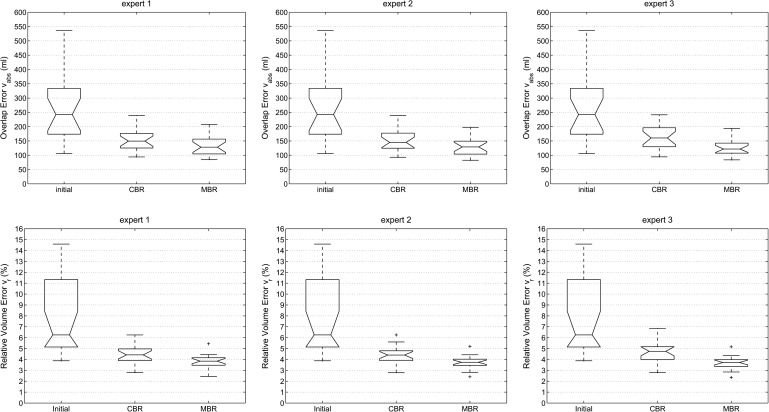
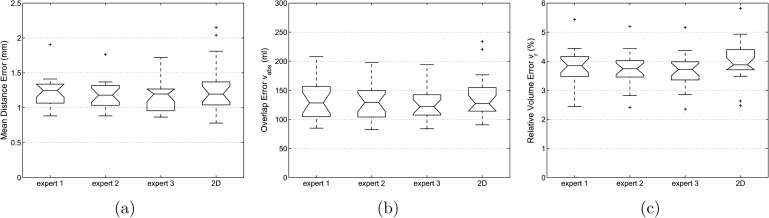
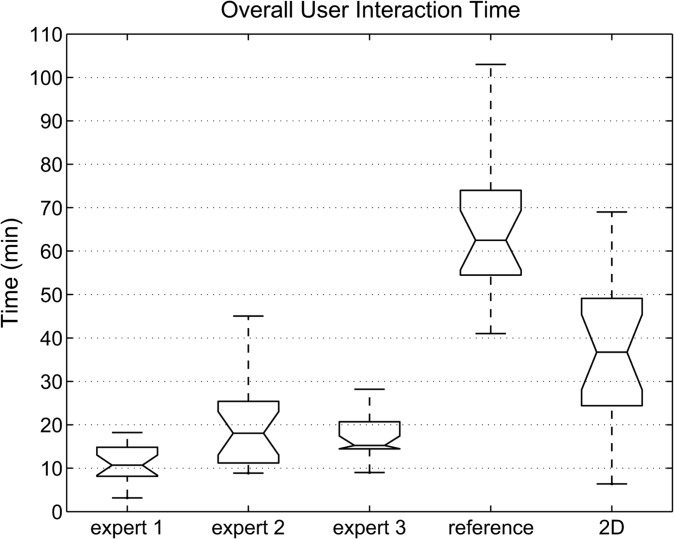
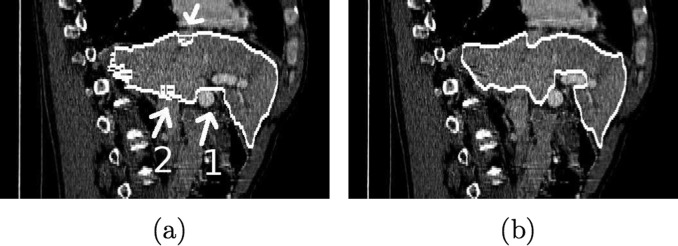
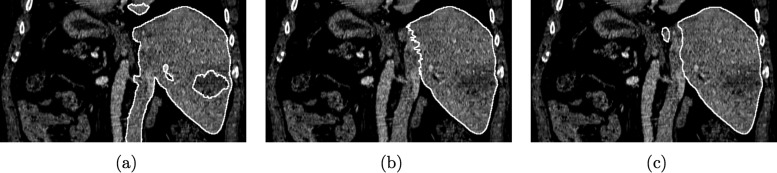
Results: Compared to the independent standard, the relative volumetric segmentation overlap error averaged over all three experts and all twenty data sets was 3.74%. Liver segmentation required on average 16 min of user interaction per case. The calculated relative volumetric overlap errors were not found to be significantly different [analysis of variance (ANOVA) test, p = 0.82] between experts who utilized the proposed 3D system. In contrast, the time required by each expert for segmentation was found to be significantly different (ANOVA test, p = 0.0009). Major differences between generated segmentations and independent references were observed in areas were vessels enter or leave the liver and no accepted criteria for defining liver boundaries exist. In comparison, slice-by-slice based generation of the independent standard utilizing a live wire tool took 70.1 min on average. A standard 2D segmentation refinement approach applied to all twenty data sets required on average 38.2 min of user interaction and resulted in statistically not significantly different segmentation error indices (ANOVA test, significance level of 0.05).

Conclusions: All three experts were able to produce liver segmentations with low error rates. User interaction time savings of up to 71% compared to a 2D refinement approach demonstrate the utility and potential of our approach. The system offers a range of different tools to manipulate segmentation results, and some users might benefit from a longer learning phase to develop efficient segmentation refinement strategies. The presented approach represents a generally applicable segmentation approach that can be applied to many medical image segmentation problems.


Figures

FIG. 1.
FIG. 1.
Example of an axial CT slice showing an enlarged human liver with inhomogeneous gray-value appearance due to pathological changes.
FIG. 2.
FIG. 2.
Boundary term calculation. (a) Original image. (b) Magnitude of the 3D structure tensor image W(x).
FIG. 3.
FIG. 3.
Example of chunk-based segmentation refinement (CBR). (a) Coronal slice of CT volume showing liver and adjacent vena cava inferior imaged with similar gray-values. The border between these two objects can be barely seen. (b) Initial graph cut result composed of chunks. (c) CBR result after two chunks have been removed—the leak has been successfully removed with a minimal amount of user interaction. Note that disconnected chunks are removed automatically. For (b) and (c) a point-rendering method is used for visualization of volume chunks.
FIG. 4.
FIG. 4.
2D illustration of the volume chunk generation process described in Sec. II C. (a) Binary boundary scene. (b) Distance map. (c) Height map. (d) Initial watershed segmentation, (e) Watershed segmentation with assigned boundaries.
FIG. 5.
FIG. 5.
Utilization of the sphere deformation tool to correct a leak. (a) Marking the region containing the segmentation error. (b) Refinement using the sphere tool. (c) After applying the sphere tool, the error is corrected. (d) The corrected region in wire frame mode highlighting the mesh contour.
FIG. 6.
FIG. 6.
Segmentation refinement using the template shape tool. First, contours are drawn on the cutting plane showing context data, leading to a rough sketch of the erroneous region in form of polygonal lines. Usually a small number of contours is sufficient. In the next stage, the contours are interpolated using a spline surface to form the template shape. In this stage, contours can still be edited, thereby updating the template. Finally, the model automatically deforms towards the template shape.
FIG. 7.
FIG. 7.
Hybrid system setup. The VR setup consists of a stereoscopic projection screen and an optical tracking system to track the user’s head and the input device (a) and (b). For the 2D setup, a touchscreen or an arbitrary tracked screen can be placed in front of the user. (c) In case of a tracked screen mouse input is calculated by utilizing data from the tracking system. (d) Alternatively, a touch screen or a tablet PC can be used directly.
FIG. 8.
FIG. 8.
Input device utilized for 2D and 3D interaction. Various buttons are used to trigger interaction. The device is also equipped with tracking targets for optical tracking.
FIG. 9.
FIG. 9.
Distance error dmean for all three experts and different processing stages of the segmentation refinement process; initial: error after initial graph cut segmentation; CBR: error after chunk-based refinement; MBR: final result after mesh-based refinement.
FIG. 10.
FIG. 10.
Volume-based error indices vabs and vr for all three experts and different processing stages of the segmentation refinement process; initial: error after initial graph cut segmentation; CBR: error after chunk-based refinement; MBR: final result after mesh-based refinement.
FIG. 11.
FIG. 11.
Comparison of segmentation refinement results between the proposed method (expert 1–expert 3) and 2D-based segmentation refinement. (a) Mean distance error dmean. (b) Overlap error vabs. (c) Relative volume error Vr.
FIG. 12.
FIG. 12.
User interaction time needed for the segmentation of the 20 test cases. The interaction times required for generating the reference segmentation using a live wire and 2D tool are shown for comparison.
FIG. 13.
FIG. 13.
Example showing segmented axial CT slices of a data set. (a)–(d) Live wire reference segmentation. (e)–(h) Result after MBR performed by expert 3. Differences in the region of portal vein entrance are clearly visible.
FIG. 14.
FIG. 14.
Comparison between (a) reference segmentation and (b) MBR segmentation result (expert 3) in a sagittal slice. The area of portal vein entrance is marked with a white arrow and the number one in (a), and regions close to the vena cava inferior are marked with arrows and the number two. Axial images of the same data set are depicted in Fig. 13.
FIG. 15.
FIG. 15.
Comparison of segmentation refinement approaches. (a) Initial graph cut segmentation, (b) Corresponding 2D (slice-by-slice) segmentation refinement result. (c) Corresponding 3D (after MBR) segmentation refinement result generated by expert 1.

References

    1. The World Health Report, World Health Organization http://www.who.int/whr/2004/en
    1. Burak K. W. and Bathe O. F., “Is surgical resection still the treatment of choice for early hepato-cellular carcinoma?,” J. Surg. Oncol. 104 (1), 1–2 (2011). 10.1002/jso.21765 - DOI - PubMed
    1. Llovet J. M., Schwartz M., and Mazzaferro V., “Resection and liver transplantation for hepato-cellular carcinoma,” Semin Liver Dis. 25 (2), 181–200 (2005). 10.1055/s-2005-871198 - DOI - PubMed
    1. Lamade W., Glombitza G., Fischer L., Chiu P., Cardenas C. E., Thorn M., Meinzer H.-P., Grenacher L., Bauer H., Lehnert T., and Herfarth C., “The impact of 3-dimensional reconstructions on operation planning in liver surgery,” Arch. Surg. 135 (11), 1256–1261 (2000). 10.1001/archsurg.135.11.1256 - DOI - PubMed
    1. Selle D., Preim B., Schenk A., and Peitgen H.-O., “Analysis of vasculature for liver surgical planning,” IEEE Trans. Med. Imaging 21 (11), 1344–1357 (2002). 10.1109/TMI.2002.801166 - DOI - PubMed

MeSH terms