

Spatial and temporal distribution of Oct-4 and acetylated H4K5 in rabbit embryos
- PMID: 22381206
- PMCID: PMC3320679
- DOI: 10.1016/j.rbmo.2012.01.001
Spatial and temporal distribution of Oct-4 and acetylated H4K5 in rabbit embryos
Abstract
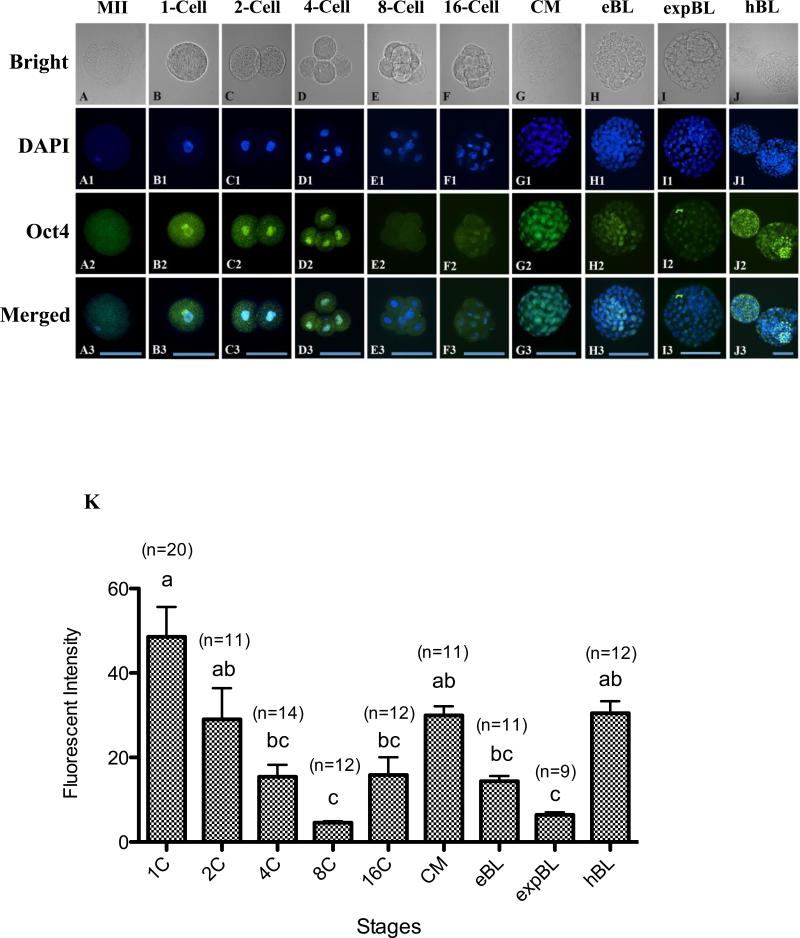
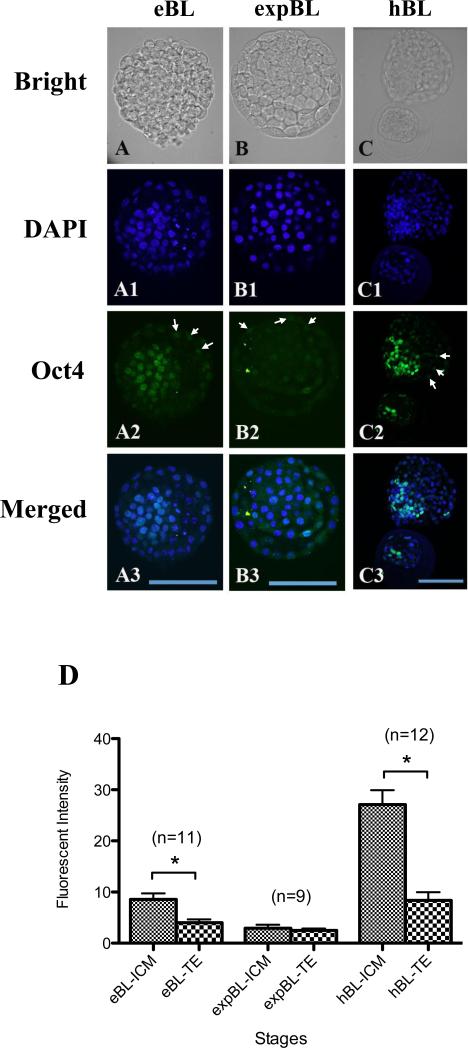
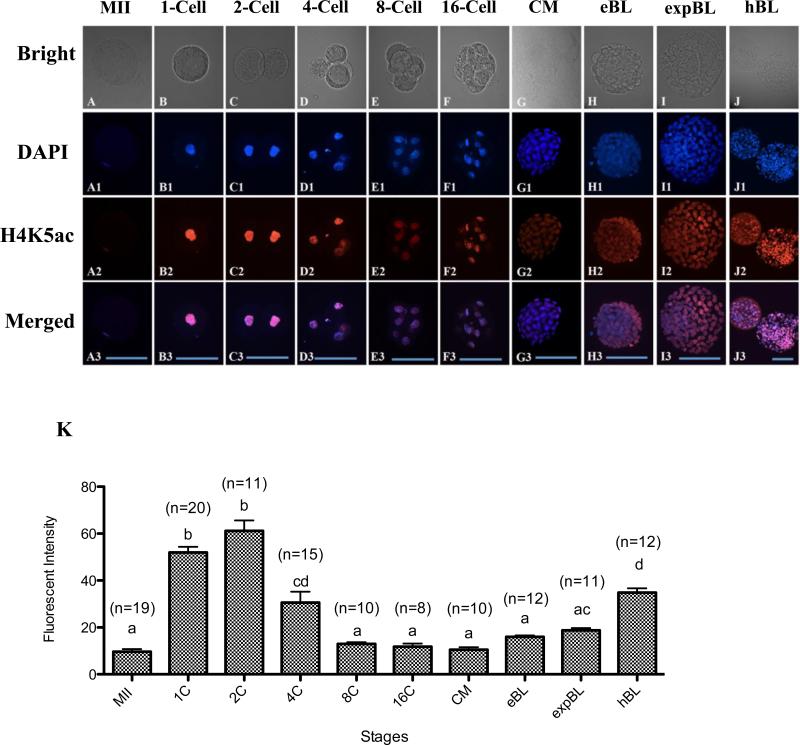
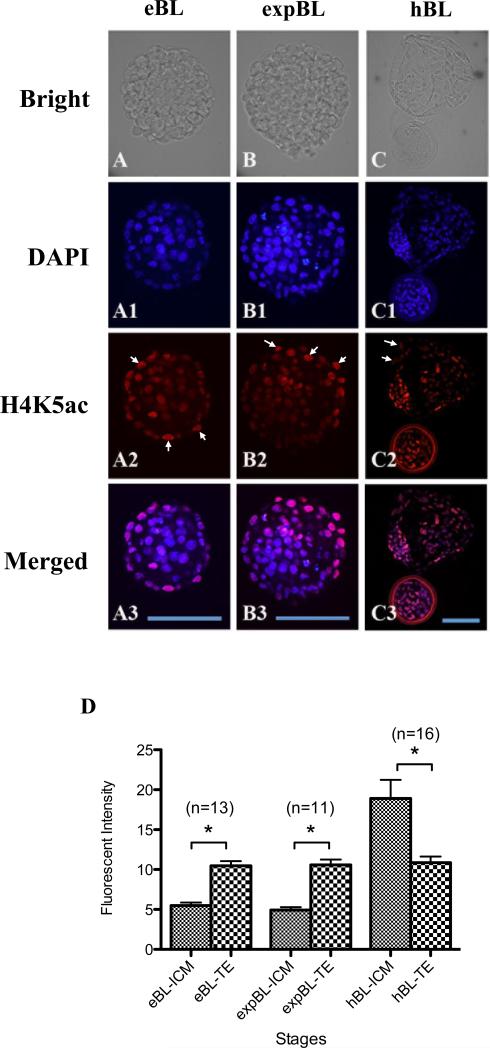
Rabbit is a unique species to study human embryology; however, there are limited reports on the key transcription factors and epigenetic events of rabbit embryos. This study examined the Oct-4 and acetylated H4K5 (H4K5ac) patterns in rabbit embryos using immunochemistry staining. The average intensity of the Oct-4 signal in the nuclei of the whole embryo spiked upon fertilization, then decreased until the 8-cell stage and increased afterwards until the compact morula (CM) stage. It decreased thereafter from the CM stage to the early blastocyst (EB) stage, with a minimum at the expanded blastocyst (EXPB) stage and came back to a level similar to that of the CM-stage embryos in the hatching blastocysts (HB). The Oct-4 signal was observed in both the inner cell mass (ICM) and the trophectoderm (TE) cells of blastocysts. The average H4K5ac signal intensity of the whole embryo increased upon fertilization, started to decrease at the 4-cell stage, reached a minimum at the 8-cell stage, increased again at the EXPB stage and peaked at the HB stage. While TE cells maintained similar levels of H4K5ac throughout the blastocyst stages, ICM cells of HB showed higher levels of H4K5ac than those of EB and EXPB. Understanding key genetic and epigenetic events during early embryo development will help to identify factors contributing to embryo losses and consequently improve embryo survival rates. As a preferred laboratory species for many human disease studies such as atherosclerosis, rabbit is also a pioneer species in the development of several embryo biotechnologies, such as IVF, transgenesis, animal cloning, embryo cryopreservation and embryonic stem cells. However, there are limited reports on key transcription factors and epigenetic events of rabbit embryos. In the present study, we documented the temporal and spatial distribution of Oct-4 protein and H4K5 acetylation during early embryo development using the immunostaining approach. We also compared the patterns of these two important biomarkers between the inner cell mass (ICM) and the trophectoderm (TE) cells in blastocyst-stage embryos. Our findings suggest that a combination of Oct-4, H4K5ac and possibly other biomarkers such as Cdx-2 is needed to accurately identify different lineages of cells in morula and blastocyst stage rabbit embryos. Importantly, we revealed a novel wave of Oct-4 intensity change in the ICM cells of rabbit blastocysts. The signal was high at the early blastocyst stage, reached a minimum at the expanded blastocyst stage and returned to a high level at the hatching blastocyst stage. We hypothesize that the signal may have reflected the regulation of Oct-4 through enhancer switching and therefore may be related to cell lineage formation in rabbit embryos. These findings enrich our understanding on key genetic and epigenetic programming events during early embryo development in rabbits.
Copyright © 2012 Reproductive Healthcare Ltd. Published by Elsevier Ltd. All rights reserved.
Figures
Similar articles
-
Dynamic profiles of Oct-4, Cdx-2 and acetylated H4K5 in in-vivo-derived rabbit embryos.Reprod Biomed Online. 2012 Oct;25(4):358-70. doi: 10.1016/j.rbmo.2012.07.001. Epub 2012 Jul 17. Reprod Biomed Online. 2012. PMID: 22877942 Free PMC article.
-
Synergistic effect of trichostatin A and scriptaid on the development of cloned rabbit embryos.Theriogenology. 2013 Jun;79(9):1284-93. doi: 10.1016/j.theriogenology.2013.03.003. Epub 2013 Apr 6. Theriogenology. 2013. PMID: 23566670 Free PMC article.
-
Lineage segregation in human pre-implantation embryos is specified by YAP1 and TEAD1.Hum Reprod. 2023 Aug 1;38(8):1484-1498. doi: 10.1093/humrep/dead107. Hum Reprod. 2023. PMID: 37295962
-
Roles of cell differentiation factors in preimplantation development of domestic animals.J Reprod Dev. 2021 Jun 21;67(3):161-165. doi: 10.1262/jrd.2021-031. Epub 2021 Apr 27. J Reprod Dev. 2021. PMID: 33907058 Free PMC article. Review.
-
The cytogenetic constitution of human blastocysts: insights from comprehensive chromosome screening strategies.Hum Reprod Update. 2019 Jan 1;25(1):15-33. doi: 10.1093/humupd/dmy036. Hum Reprod Update. 2019. PMID: 30395265 Review.
Cited by
-
Derivation of Rabbit Embryonic Stem Cells from Vitrified-Thawed Embryos.Cell Reprogram. 2015 Dec;17(6):453-62. doi: 10.1089/cell.2015.0044. Epub 2015 Nov 18. Cell Reprogram. 2015. PMID: 26579970 Free PMC article.
-
Dynamic profiles of Oct-4, Cdx-2 and acetylated H4K5 in in-vivo-derived rabbit embryos.Reprod Biomed Online. 2012 Oct;25(4):358-70. doi: 10.1016/j.rbmo.2012.07.001. Epub 2012 Jul 17. Reprod Biomed Online. 2012. PMID: 22877942 Free PMC article.
-
Synergistic effect of trichostatin A and scriptaid on the development of cloned rabbit embryos.Theriogenology. 2013 Jun;79(9):1284-93. doi: 10.1016/j.theriogenology.2013.03.003. Epub 2013 Apr 6. Theriogenology. 2013. PMID: 23566670 Free PMC article.
-
Combined treatment with cysteamine and leukemia inhibitory factor promotes guinea pig oocyte meiosis in vitro.Am J Transl Res. 2019 Dec 15;11(12):7479-7491. eCollection 2019. Am J Transl Res. 2019. PMID: 31934295 Free PMC article.
-
Spontaneous generation of germline characteristics in mouse fibrosarcoma cells.Sci Rep. 2012;2:743. doi: 10.1038/srep00743. Epub 2012 Oct 17. Sci Rep. 2012. PMID: 23077727 Free PMC article.
References
-
- Ambros V. microRNAs: Tiny regulators with great potential. Cell. 2001;107:823–26. - PubMed
-
- Berg DK, Smith CS, Pearton DJ, Wells DN, Broadhurst R, Donnison M, Pfeffer PL. Trophectoderm lineage determination in cattle. Dev Cell. 2011;20:244–55. - PubMed
-
- Boiani M, Scholer HR. Regulatory networks in embryo-derived pluripotent stem cells. Nature reviews. Molecular cell biology. 2005;6:872–84. - PubMed
-
- Cauffman G, van de Velde H, Liebaers I, van Steirteghem A. Oct-4 mRNA and protein expression during human preimplantation development. Molecular human reproduction. 2005;11:173–81. - PubMed
Publication types
MeSH terms
Substances
Grants and funding
LinkOut - more resources
Full Text Sources
Research Materials
