

Interpreting protein structural dynamics from NMR chemical shifts
- PMID: 22381384
- PMCID: PMC3324661
- DOI: 10.1021/ja300265w
Interpreting protein structural dynamics from NMR chemical shifts
Abstract
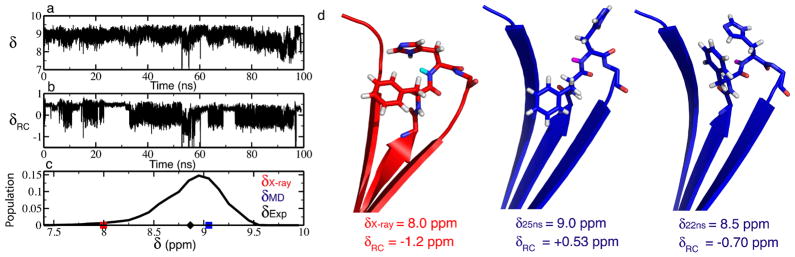
In this investigation, semiempirical NMR chemical shift prediction methods are used to evaluate the dynamically averaged values of backbone chemical shifts obtained from unbiased molecular dynamics (MD) simulations of proteins. MD-averaged chemical shift predictions generally improve agreement with experimental values when compared to predictions made from static X-ray structures. Improved chemical shift predictions result from population-weighted sampling of multiple conformational states and from sampling smaller fluctuations within conformational basins. Improved chemical shift predictions also result from discrete changes to conformations observed in X-ray structures, which may result from crystal contacts, and are not always reflective of conformational dynamics in solution. Chemical shifts are sensitive reporters of fluctuations in backbone and side chain torsional angles, and averaged (1)H chemical shifts are particularly sensitive reporters of fluctuations in aromatic ring positions and geometries of hydrogen bonds. In addition, poor predictions of MD-averaged chemical shifts can identify spurious conformations and motions observed in MD simulations that may result from force field deficiencies or insufficient sampling and can also suggest subsets of conformational space that are more consistent with experimental data. These results suggest that the analysis of dynamically averaged NMR chemical shifts from MD simulations can serve as a powerful approach for characterizing protein motions in atomistic detail.
© 2012 American Chemical Society
Figures


Similar articles
-
PPM: a side-chain and backbone chemical shift predictor for the assessment of protein conformational ensembles.J Biomol NMR. 2012 Nov;54(3):257-65. doi: 10.1007/s10858-012-9668-8. Epub 2012 Sep 13. J Biomol NMR. 2012. PMID: 22972619
-
Experimental verification of force fields for molecular dynamics simulations using Gly-Pro-Gly-Gly.J Phys Chem B. 2010 Sep 30;114(38):12358-75. doi: 10.1021/jp101581h. J Phys Chem B. 2010. PMID: 20825228
-
Assessment of the use of NMR chemical shifts as replica-averaged structural restraints in molecular dynamics simulations to characterize the dynamics of proteins.J Phys Chem B. 2013 Feb 14;117(6):1838-43. doi: 10.1021/jp3106666. Epub 2013 Feb 1. J Phys Chem B. 2013. PMID: 23327201
-
NMR Methods for Characterizing the Basic Side Chains of Proteins: Electrostatic Interactions, Hydrogen Bonds, and Conformational Dynamics.Methods Enzymol. 2019;615:285-332. doi: 10.1016/bs.mie.2018.08.017. Epub 2018 Sep 27. Methods Enzymol. 2019. PMID: 30638532 Free PMC article. Review.
-
Molecular Dynamics Simulations Combined with Nuclear Magnetic Resonance and/or Small-Angle X-ray Scattering Data for Characterizing Intrinsically Disordered Protein Conformational Ensembles.J Chem Inf Model. 2019 May 28;59(5):1743-1758. doi: 10.1021/acs.jcim.8b00928. Epub 2019 Mar 18. J Chem Inf Model. 2019. PMID: 30840442 Review.
Cited by
-
Molecular basis for curvature formation in SepF polymerization.Proc Natl Acad Sci U S A. 2024 Feb 27;121(9):e2316922121. doi: 10.1073/pnas.2316922121. Epub 2024 Feb 21. Proc Natl Acad Sci U S A. 2024. PMID: 38381790 Free PMC article.
-
An Evaluation of the Potential of NMR Spectroscopy and Computational Modelling Methods to Inform Biopharmaceutical Formulations.Pharmaceutics. 2018 Sep 21;10(4):165. doi: 10.3390/pharmaceutics10040165. Pharmaceutics. 2018. PMID: 30248922 Free PMC article. Review.
-
Integrated Computational Approaches and Tools forAllosteric Drug Discovery.Int J Mol Sci. 2020 Jan 28;21(3):847. doi: 10.3390/ijms21030847. Int J Mol Sci. 2020. PMID: 32013012 Free PMC article. Review.
-
Permeating disciplines: Overcoming barriers between molecular simulations and classical structure-function approaches in biological ion transport.Biochim Biophys Acta Biomembr. 2018 Apr;1860(4):927-942. doi: 10.1016/j.bbamem.2017.12.013. Epub 2017 Dec 16. Biochim Biophys Acta Biomembr. 2018. PMID: 29258839 Free PMC article. Review.
-
Mechanisms of amyloid formation revealed by solution NMR.Prog Nucl Magn Reson Spectrosc. 2015 Aug;88-89:86-104. doi: 10.1016/j.pnmrs.2015.05.002. Epub 2015 May 27. Prog Nucl Magn Reson Spectrosc. 2015. PMID: 26282197 Free PMC article. Review.
References
-
- Pardi A, Wagner G, Wuthrich K. Eur J Biochem. 1983;137:445–54. - PubMed
-
- Osapay K, Case D. J Am Chem Soc. 1991;113:9436–9444.
-
- Wishart DS, Sykes BD, Richards FM. J Mol Biol. 1991;222:311–33. - PubMed
-
- Williamson MP, Asakura T. J Magn Reson Ser B. 1993;101:63–71.
-
- Xu XP, Case DA. J Biomol NMR. 2001;21:321–333. - PubMed
Publication types
MeSH terms
Substances
Grants and funding
LinkOut - more resources
Full Text Sources
