

Developing a summary hospital mortality index: retrospective analysis in English hospitals over five years
- PMID: 22381521
- PMCID: PMC3291118
- DOI: 10.1136/bmj.e1001
Developing a summary hospital mortality index: retrospective analysis in English hospitals over five years
Erratum in
- BMJ. 2013;347:f5103
Abstract
Objectives: To develop a transparent and reproducible measure for hospitals that can indicate when deaths in hospital or within 30 days of discharge are high relative to other hospitals, given the characteristics of the patients in that hospital, and to investigate those factors that have the greatest effect in changing the rank of a hospital, whether interactions exist between those factors, and the stability of the measure over time.
Design: Retrospective cross sectional study of admissions to English hospitals.
Setting: Hospital episode statistics for England from 1 April 2005 to 30 September 2010, with linked mortality data from the Office for National Statistics.
Participants: 36.5 million completed hospital admissions in 146 general and 72 specialist trusts.
Main outcome measures: Deaths within hospital or within 30 days of discharge from hospital.
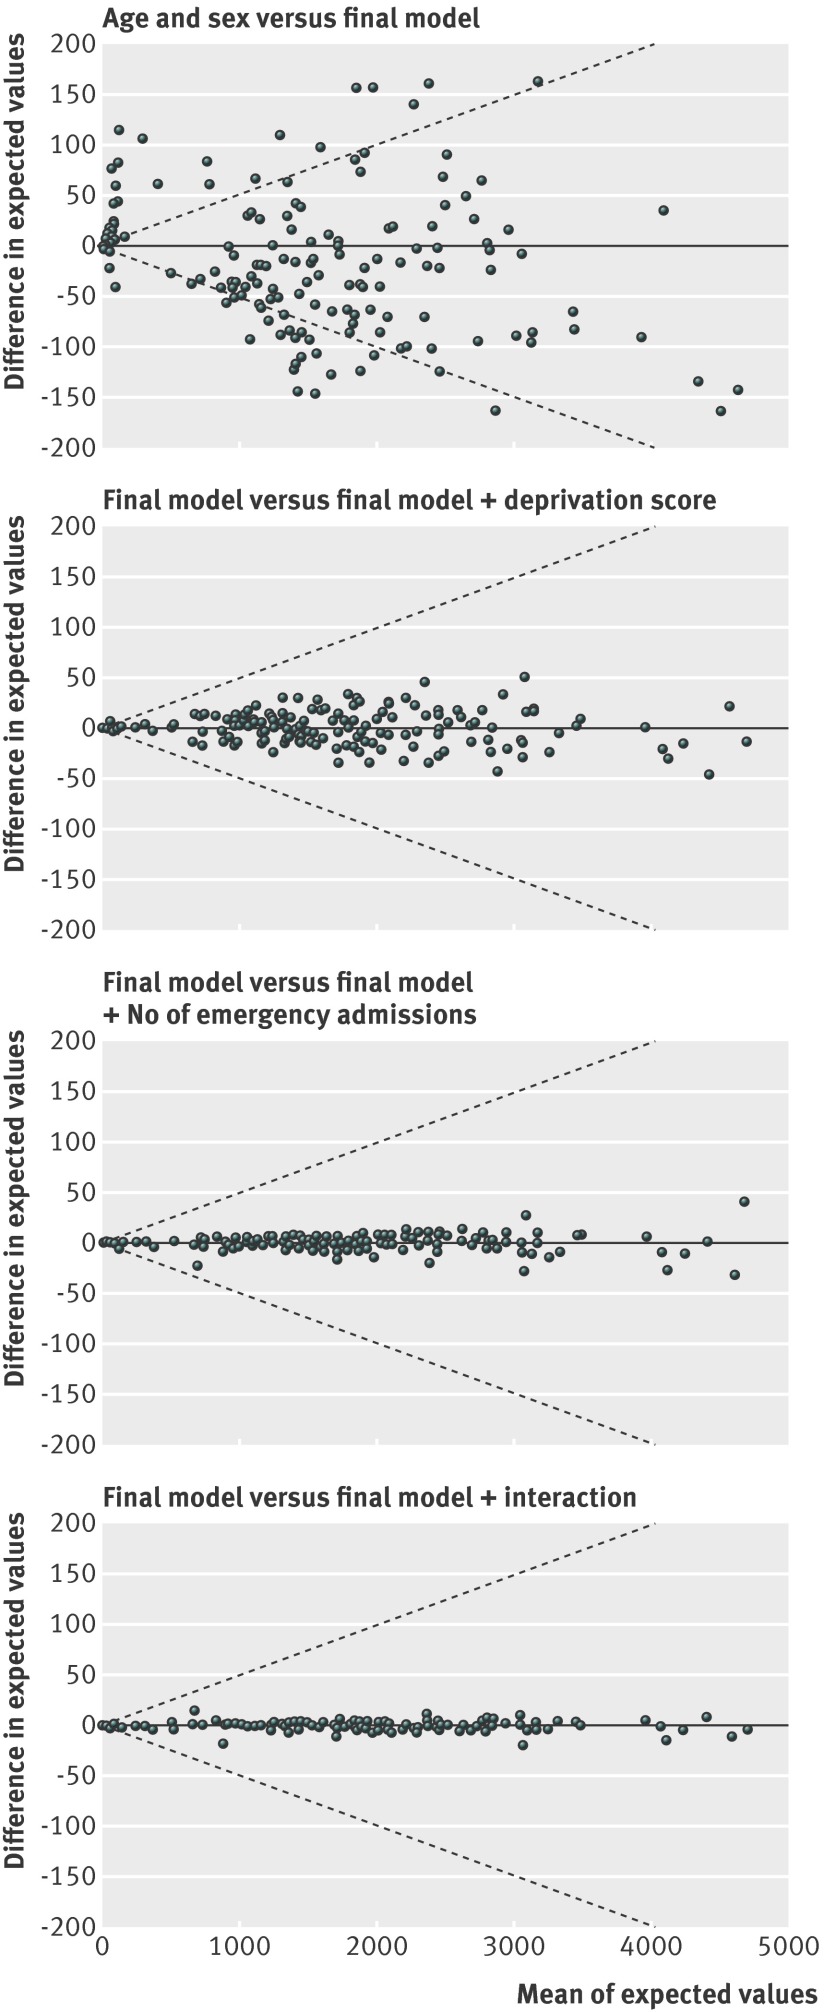
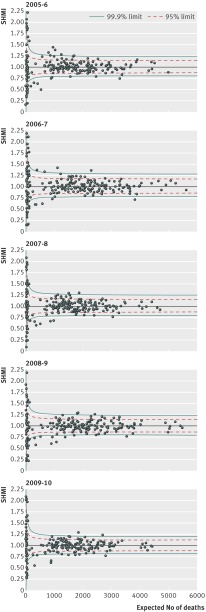
Results: The predictors that were used in the final model comprised admission diagnosis, age, sex, type of admission, and comorbidity. The percentage of people admitted who died in hospital or within 30 days of discharge was 4.2% for males and 4.5% for females. Emergency admissions comprised 75% of all admissions and 5.5% died, in contrast to 0.8% who died after an elective admission. The percentage who died with a Charlson comorbidity score of 0 was 2% in contrast with 15% who died with a score greater than 5. Given these variables, the relative standardised mortality rates of the hospitals were not noticeably changed by adjusting for the area level deprivation and number of previous emergency visits to hospital. There was little evidence that including interaction terms changed the relative values by any great amount. Using these predictors the summary hospital mortality index (SHMI) was derived. For 2007/8 the model had a C statistic of 0.911 and accounted for 81% of the variability of between hospital mortality. A random effects funnel plot was used to identify outlying hospitals. The outliers from the SHMI over the period 2005-10 have previously been identified using other mortality indicators.
Conclusion: The SHMI is a relatively simple tool that can be used in conjunction with other information to identify hospitals that may need further investigation.
Conflict of interest statement
Competing interests: All authors have completed the ICMJE uniform disclosure form at
Figures
Similar articles
-
Did hospital mortality in England change from 2005 to 2010? A retrospective cohort analysis.BMC Health Serv Res. 2013 Jun 13;13:216. doi: 10.1186/1472-6963-13-216. BMC Health Serv Res. 2013. PMID: 23763942 Free PMC article.
-
Death within 1 year among emergency medical admissions to Scottish hospitals: incident cohort study.BMJ Open. 2018 Jun 30;8(6):e021432. doi: 10.1136/bmjopen-2017-021432. BMJ Open. 2018. PMID: 29961029 Free PMC article.
-
Weekend admission to hospital has a higher risk of death in the elective setting than in the emergency setting: a retrospective database study of national health service hospitals in England.BMC Health Serv Res. 2012 Apr 2;12:87. doi: 10.1186/1472-6963-12-87. BMC Health Serv Res. 2012. PMID: 22471933 Free PMC article.
-
Factors associated with variation in hospital use at the end of life in England.BMJ Support Palliat Care. 2019 Jun;9(2):167-174. doi: 10.1136/bmjspcare-2015-000936. Epub 2016 Mar 24. BMJ Support Palliat Care. 2019. PMID: 27013618 Free PMC article.
-
Learning from hospital mortality.Clin Med (Lond). 2016 Dec;16(6):530-534. doi: 10.7861/clinmedicine.16-6-530. Clin Med (Lond). 2016. PMID: 27927816 Free PMC article. Review.
Cited by
-
Can Patient Safety Incident Reports Be Used to Compare Hospital Safety? Results from a Quantitative Analysis of the English National Reporting and Learning System Data.PLoS One. 2015 Dec 9;10(12):e0144107. doi: 10.1371/journal.pone.0144107. eCollection 2015. PLoS One. 2015. PMID: 26650823 Free PMC article.
-
Predictors of In-Hospital Mortality in Surgical Wards: A Multivariable Retrospective Cohort Analysis of 2,800,069 Hospitalizations.World J Surg. 2021 Feb;45(2):480-487. doi: 10.1007/s00268-020-05841-3. Epub 2020 Oct 26. World J Surg. 2021. PMID: 33104832 Free PMC article.
-
Learning from practice variation to improve the quality of care.Clin Med (Lond). 2013 Feb;13(1):19-23. doi: 10.7861/clinmedicine.13-1-19. Clin Med (Lond). 2013. PMID: 23472488 Free PMC article. Review.
-
Registered nurse, healthcare support worker, medical staffing levels and mortality in English hospital trusts: a cross-sectional study.BMJ Open. 2016 Feb 9;6(2):e008751. doi: 10.1136/bmjopen-2015-008751. BMJ Open. 2016. PMID: 26861934 Free PMC article.
-
Staffing levels and hospital mortality in England: a national panel study using routinely collected data.BMJ Open. 2023 May 17;13(5):e066702. doi: 10.1136/bmjopen-2022-066702. BMJ Open. 2023. PMID: 37197808 Free PMC article.
References
-
- The national end of life care intelligence network , Department of Health, 2011. www.endoflifecare-intelligence.org.uk/profiles/2/Place_of_Death/atlas.html.
-
- Aylin P, Bottle A, Jen HM, Middleton S. HSMR mortality indicator, 2010. www.drfosterintelligence.co.uk/newsPublications/HSMRMethodology.asp.
-
- Hawkes N. Patient coding and the ratings game. BMJ 2010;340:c2153. - PubMed
Publication types
MeSH terms
Grants and funding
LinkOut - more resources
Full Text Sources
Medical
Miscellaneous