. 2012 May 1;21(9):1989-2004.
doi: 10.1093/hmg/dds012. Epub 2012 Mar 1.

Amelioration of Duchenne muscular dystrophy in mdx mice by elimination of matrix-associated fibrin-driven inflammation coupled to the αMβ2 leukocyte integrin receptor

Affiliations

Amelioration of Duchenne muscular dystrophy in mdx mice by elimination of matrix-associated fibrin-driven inflammation coupled to the αMβ2 leukocyte integrin receptor

Berta Vidal et al. Hum Mol Genet. .

Abstract

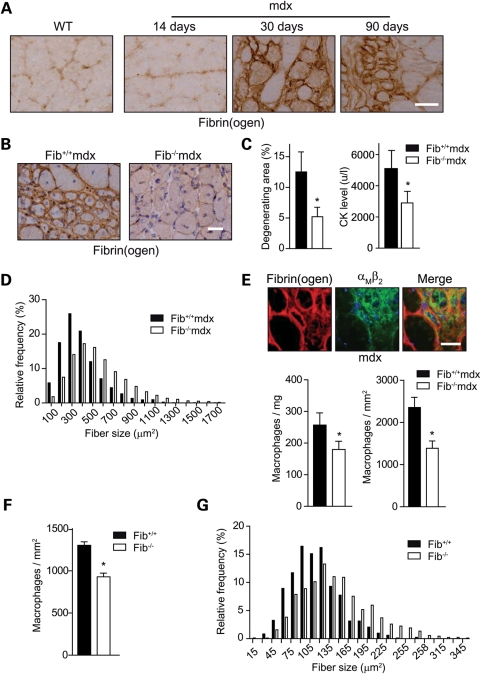
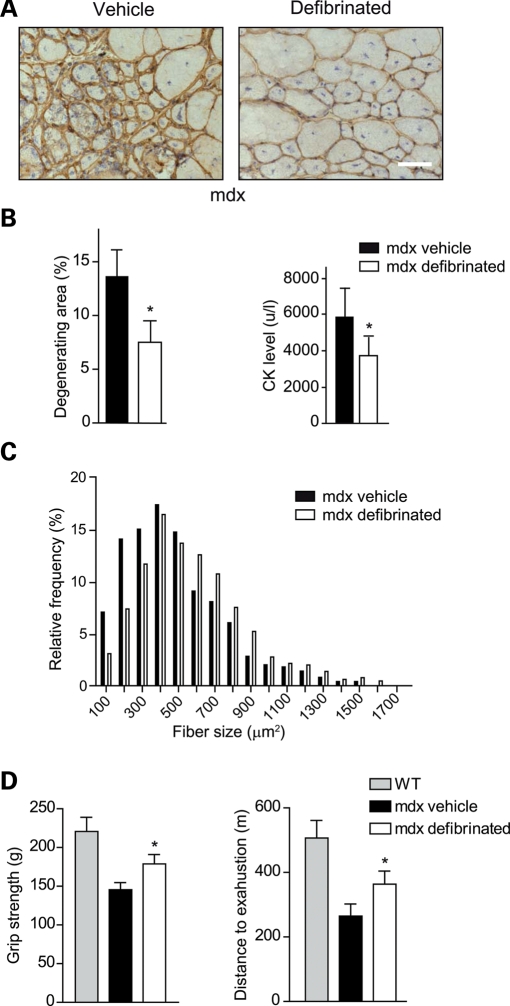
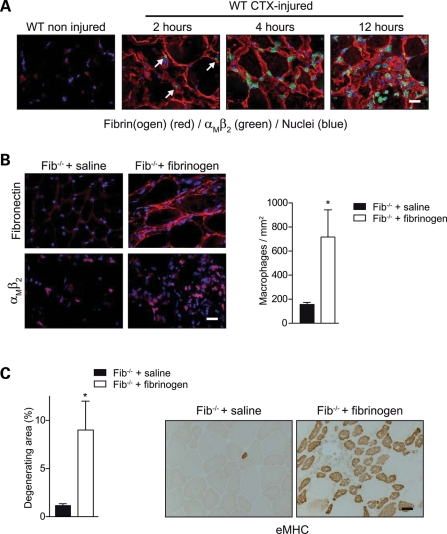
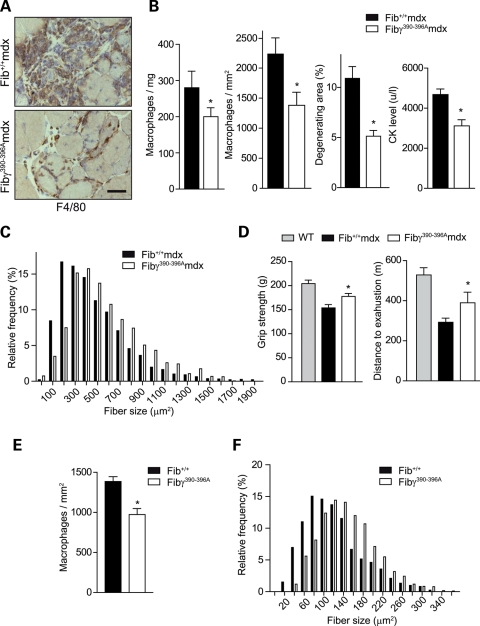
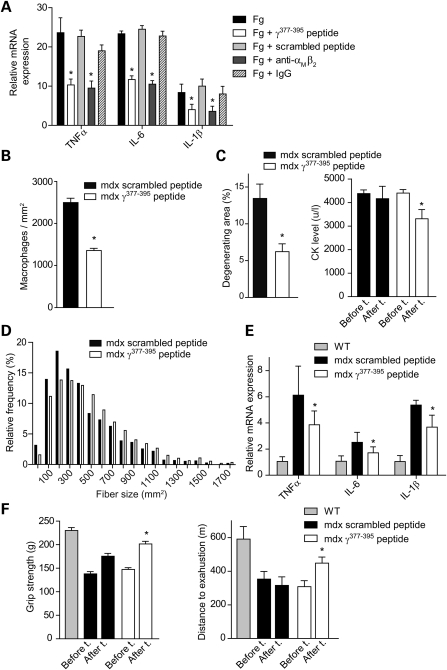
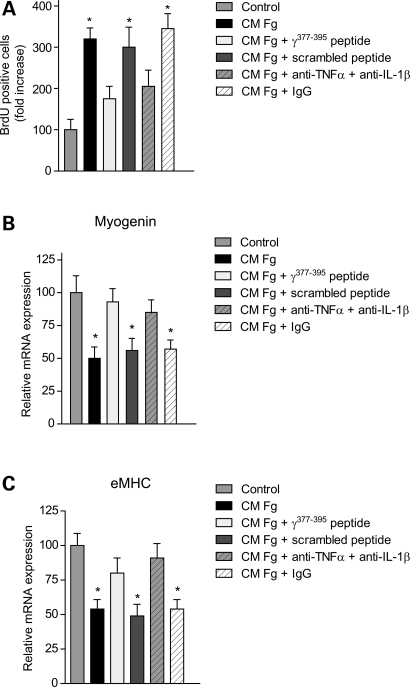
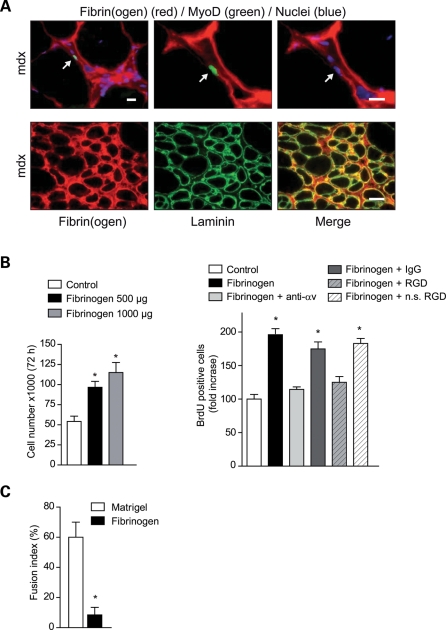
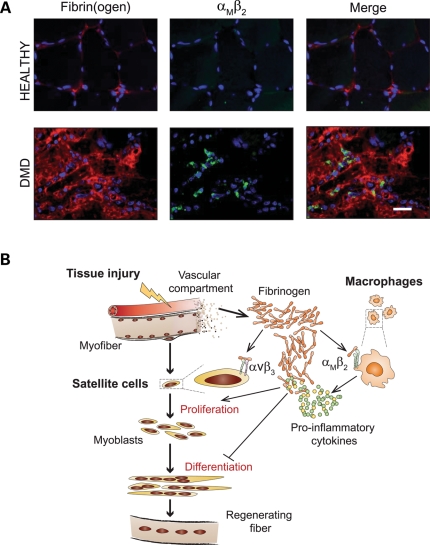
In Duchenne muscular dystrophy (DMD), a persistently altered and reorganizing extracellular matrix (ECM) within inflamed muscle promotes damage and dysfunction. However, the molecular determinants of the ECM that mediate inflammatory changes and faulty tissue reorganization remain poorly defined. Here, we show that fibrin deposition is a conspicuous consequence of muscle-vascular damage in dystrophic muscles of DMD patients and mdx mice and that elimination of fibrin(ogen) attenuated dystrophy progression in mdx mice. These benefits appear to be tied to: (i) a decrease in leukocyte integrin α(M)β(2)-mediated proinflammatory programs, thereby attenuating counterproductive inflammation and muscle degeneration; and (ii) a release of satellite cells from persistent inhibitory signals, thereby promoting regeneration. Remarkably, Fib-gamma(390-396A) (Fibγ(390-396A)) mice expressing a mutant form of fibrinogen with normal clotting function, but lacking the α(M)β(2) binding motif, ameliorated dystrophic pathology. Delivery of a fibrinogen/α(M)β(2) blocking peptide was similarly beneficial. Conversely, intramuscular fibrinogen delivery sufficed to induce inflammation and degeneration in fibrinogen-null mice. Thus, local fibrin(ogen) deposition drives dystrophic muscle inflammation and dysfunction, and disruption of fibrin(ogen)-α(M)β(2) interactions may provide a novel strategy for DMD treatment.


Figures

Figure 1.
Figure 1.
Fibrin(ogen) accumulates in mdx dystrophic muscle, and fibrin(ogen) deficiency results in reduced muscle degeneration and enhanced regeneration. (A) Fibrin(ogen) deposition was analyzed by immunohistochemistry in gastrocnemius muscles of WT control mice and in mdx mice of 14, 30 and 90 days of age. Magnification bar: 50 µm. (B) Immunostaining for fibrin(ogen) of gastrocnemius muscles of 90-day-old mice showing the absence of fibrin(ogen) deposition in Fib−/−mdx mice when compared with Fib+/+mdx mice. Bar: 25 µm. (C) Left: reduced percentage of total muscle degeneration area in Fib−/−mdx versus Fib+/+mdx mice at 30 days of age, as determined by morphometric analysis on H&E-stained gastrocnemius muscle sections. Right: reduced muscle membrane damage in Fib−/−mdx versus Fib+/+mdx, as indicated by serum CK measurement. Data are mean ± SEM; n = 5 animals per group (*P < 0.05, Mann–Whitney test). (D) Increased CSA of growing central-nucleated fibers (CNFs) in muscles of Fib−/−mdx mice when compared with Fib+/+mdx mice (mean ± SEM, 566.5 ± 5.0 versus 394.5 ± 6.7 µm2; n = 4 animals per group; P < 0.001 Mann–Whitney test); size frequency distribution of regenerating myofibers is represented. (E) Reduced inflammatory infiltration in Fib−/−mdx muscle. Top: localization of αMβ2 (CD11b/CD18 or Mac-1) positive macrophages in the damaged areas of mdx muscle occupied by fibrin(ogen) is shown by immunofluorescence. Bar: 25 µm. Bottom left: quantification of F4/80-positive cells by flow cytometry analysis. Data are mean ± SEM; n = 3 animals per group (*P < 0.05, Mann–Whitney test). Bottom right: quantification of macrophages in Fib−/−mdx versus Fib+/+mdx muscles. Data are mean ± SEM; n = 5 animals per group (*P < 0.05, Mann–Whitney test). (F) CTX injury in muscle of Fib−/− and Fib+/+ mice. Quantification of macrophage numbers at 3 days post-injury in degenerating areas showed reduced infiltration in Fib−/− mice. Data are mean ± SEM; n = 5 animals per group (*P < 0.05, Mann–Whitney test). (G) At 5 days post-injury, the CSA of growing CNFs was larger in Fib−/− mice than in Fib+/+ controls; frequency distribution of myofiber size is represented (mean ± SEM, 141.8 ± 1.9 versus 109.5 ± 1.3 µm2; 4 animals per group; P < 0.001 Mann–Whitney test).
Figure 2.
Figure 2.
Pharmacological defibrination attenuates dystrophy progression in mdx muscle. Twelve-day-old mdx mice were subjected to a defibrination treatment by daily intraperitoneal injection with ancrod (or with vehicle–control saline solution), up to 2.5 months of age. (A) Fibrin(ogen) staining of muscle sections of vehicle-treated and defibrinated mdx mice. Bar: 50 µm. (B) Left: percentage of total muscle degeneration area. Right: muscle membrane damage indicated by serum CK levels. Data are mean ± SEM; n = 5 animals per group (*P < 0.05). (C) Frequency distribution of regenerating myofiber size (mean ± SEM, 576.4 ± 11.5 mdx defibrinated versus 471.6 ± 12.1 µm2 mdx vehicle; 6 animals per group; P < 0.001 Mann–Whitney test). (D) Increased functional muscle strength in defibrinated versus vehicle-treated mdx mice. Left: four limb grip strength. Right: distance to reach exhaustion in treadmill assays. Data are mean ± SEM; 5 animals per group (*P < 0.05 versus mdx vehicle, Mann–Whitney test).
Figure 3.
Figure 3.
Intramuscular delivery of fibrinogen induces a tissue injury/repair-like response in fibrinogen-null mice. (A) Fibrin(ogen) and αMβ2 co-immunostaining of muscle sections of non-injured WT mice and at 2, 4 and 12 h after CTX injury. Bar: 25 µm. (B) Two-month-old Fib−/− mice were subjected to intramuscular delivery of saline (vehicle) or fibrinogen (9 mg/ml) into the right and left tibialis muscles, respectively. Left: representative pictures of saline and fibrinogen injected muscles stained for fibronectin and αMβ2. Bar: 25 µm. Right: quantification of the number of macrophages showed increased infiltration in fibrinogen- versus saline-treated muscles in Fib−/− mice at day 3 after injection. Data are mean ± SEM; n = 4 animals per group (*P < 0.05 versus saline-treated animals, Mann–Whitney test). (C) Induction of muscle degeneration and regeneration by fibrinogen delivery in Fib−/− mice. Left: percentages of total muscle degeneration area in saline versus fibrinogen-treated Fib−/− muscle at 2 days after injury, as determined by morphometric analysis on H&E-stained sections. Data are mean ± SEM; n = 4 animals per group (*P < 0.05 versus Fib−/− saline, Mann–Whitney test). Right: presence of numerous embryonic myosin heavy-chain (eMHC)-positive fibers at 5 days after fibrinogen administration to Fib−/− muscles as revealed by immunoperoxidase staining. Bar: 25 µm.
Figure 4.
Figure 4.
Interaction of fibrin(ogen) with αMβ2 integrin receptor on macrophages regulates inflammation, degeneration and regeneration in mdx muscle. (A) Representative macrophage F4/80 immunostaining of muscle sections from Fib+/+mdx and Fibγ390−396Amdx mice. Bar: 50 µm. (B) Reduced muscle inflammatory macrophage infiltration analyzed by flow cytometry (*P < 0.05 versus Fib+/+mdx animals, Mann–Whitney test, n = 3 animals per group) and morphologically by immunohistochemistry, percentage of total muscle degeneration area in gastrocnemius muscles and serum CK levels in 2.5-month-old Fibγ390−396Amdx mice when compared with age-matched Fib+/+mdx mice. Data are mean ± SEM; n = 4 animals per group (*P < 0.05 versus Fib+/+mdx animals, Mann–Whitney test). (C) Increased CSA of growing CFNs in Fibγ390-396Amdx versus Fib+/+mdx muscle. Frequency distribution of regenerating myofiber size is represented (mean ± SEM, 576.3 ± 7.4 Fibγ390-396Amdx versus 481.4 ± 7.5 µm2 Fib+/+mdx; 4 animals per group; P < 0.001 Mann–Whitney test). (D) Increased performance in Fibγ390-396Amdx versus Fib+/+mdx mice of 2.5 months of age, using four limb grip strength assays and treadmill exhaustion test. Data are mean ± SEM; n = 5 animals per group. (*P < 0.05 versus Fib+/+mdx, Mann–Whitney test). (E) Quantification of the number of macrophages (identified by F4/80 immunostaining) 3 days after CTX injury showing reduced inflammation in muscles of Fibγ390-396A mice. Data are mean ± SEM; n = 4 animals per group (*P < 0.05, Mann–Whitney test). (F) CTX-injured Fibγ390-396A mice show enhanced growth of regenerating myofibers compared with WT counterparts at day 5 after injury. Fiber size distribution is shown (mean ± SEM, 148.2 ± 1.4 Fibγ390-396A versus 120.6 ± 1.4 µm2 Fib+/+; 4 animals per group; P < 0.001 Mann–Whitney test).
Figure 5.
Figure 5.
Treatment with a fibrinogen-derived γ377-395 peptide blocks inflammation and disease progression in mdx mice. (A) Activation of macrophages by fibrin(ogen) is reduced by the fibrinogen-γ-derived 377–395 peptide. Primary macrophages were treated with fibrinogen (Fg) in the absence or presence of the γ377-395 peptide or scrambled peptide used as control. Additional experimental controls included treatment with an αMβ2 blocking antibody, or IgG control antibody, as indicated. Expression of inflammatory cytokines was analyzed by qRT–PCR. Results are fold-induction values with respect to untreated macrophages. Data are mean ± SEM; n = 3 experiments performed in triplicate (*P < 0.05 versus control conditions, Mann–Whitney test). (B) Inflammation is attenuated by treatment with the γ377-395 peptide in mdx mice. Mdx mice of 2 months of age were treated with γ377-395 peptide, or scrambled peptide as control, for the course of 3 weeks. Data are mean ± SEM; n = 5 animals per group (*P < 0.05, Mann–Whitney test). (C) Left: percentage of total muscle degeneration area in mdx mice treated with γ377-395 or scrambled peptides. Data are mean ± SEM; n = 5 animals per group (*P < 0.05, Mann–Whitney test). Right: extent of muscle membrane damage in mdx mice before and after the treatment with γ377-395 peptide (or scrambled peptide) as indicated by serum CK levels. Data are mean ± SEM; n = 5 animals per group (*P < 0.05 versus CK values of the same animals before the treatment, Mann–Whitney test). (D) Frequency distribution of the size of regenerating myofibers in mdx mice treated with γ377-395 peptide (or scrambled peptide) (mean ± SEM, 515.8 ± 8.4 mdx γ377-395 peptide versus 440.5 ± 8.4 µm2 mdx scrambled peptide; 4 animals per group; P < 0.001 Mann–Whitney test). (E) Reduced cytokine expression in muscles of mdx mice treated with γ377-395 peptide compared with scrambled peptide-treated mice by qRT–PCR analysis. Data are mean ± SEM; n = 5 animals per group (*P < 0.05 versus scrambled peptide treatment, Mann–Whitney test). (F) Left: increased muscle grip strength of mdx mice treated with γ377-395 peptide compared with scramble peptide-treated mice. Right: improvement of treadmill performance in an exhaustion test of mdx mice treated with a γ377-395 peptide. Data are mean ± SEM; n = 5 animals per group (*P < 0.05 versus values of the same group before the treatment, Mann–Whitney test).
Figure 6.
Figure 6.
Paracrine effect of fibrinogen-activated macrophages on satellite cells. Satellite cells obtained from mouse muscle were cultured in GM for 24 h with CM from macrophages treated or not with fibrinogen for 24 h (CM Fg), and incubated for 1 h with BrdU. When indicated, the γ377-395 peptide or scramble peptide was added to fibrinogen-stimulated macrophages. Also, neutralizing antibodies against TNFα and IL-1β (or control IgG) were added to CM from fibrinogen-stimulated macrophages. (A) Satellite cells subjected to the different macrophage-conditioned media were fixed and immunostained for BrdU, and positive cells were quantified. (B) Satellite cells were cultured in GM and then shifted to differentiation medium, supplemented with different macrophage-conditioned media as above. Comparative qRT–PCR analysis of Myogenin. (C) eMHC mRNA expression. Results represent the mean of at least three experiments. Data are mean ± SEM (*P < 0.05 versus control, one-way analysis of variance and Dunnett's multiple comparison test).
Figure 7.
Figure 7.
Fibrin(ogen) directly affects satellite cell functions. (A) Fibrin(ogen) is deposited in the basal laminae of dystrophic muscle. Top: representative example of a double immunofluorescence staining showing an activated satellite cell in green (MyoD positive, see arrow) surrounded by fibrin(ogen) (red) in a 2.5-month-old mdx gastrocnemius muscle section. Nuclei were stained with 4'-6-diamidino-2-phenylindole. Magnification bars: 10 µm. Bottom: immunohistochemistry showing fibrin(ogen) (red) and laminin (green) co-staining in a mdx muscle section. Bar: 25 µm. (B) Fibrinogen alters satellite cell functions. Left: satellite cells were cultured in GM with and without increasing amounts of fibrinogen (500 and 1000 μg fibrinogen), and viable cells were counted after 72 h as an index of cell division. Data are mean ± SEM; n = 3 experiments performed in triplicate (*P < 0.05 versus control conditions, one-way analysis of variance and Dunnett's multiple comparison test). Right: satellite cells were cultured in GM in the absence or presence of 500 μg of fibrinogen, and incubated for 1 h with BrdU. When indicated, an arg-gly-asp (RGD) peptide (a cyclic peptide that specifically interferes with αvβ3 integrin binding to ligand RGD motif) or non-specific RGD control (n.s. RGD) was also used to demonstrate fibrinogen-integrin effects on satellite cell proliferation. Similarly, a neutralizing antibody against αv integrin (or control IgG) was added. Proliferation rates were expressed as percentage of BrdU-positive cells relative to control. Data are mean ± SEM; n = 3 experiments performed in triplicate (*P < 0.05 versus control conditions, one-way analysis of variance and Dunnett's multiple comparison test). (C) Satellite cells cultured in GM were switched to DM to induce fusion. After 48 h, cells were immunostained for eMHC to define nuclei inside myotubes and fusion rates were calculated. Data are mean ± SEM; n = 3 experiments performed in triplicate (*P < 0.05 versus control matrigel conditions, Mann–Whitney test).
Figure 8.
Figure 8.
Association of fibrin(ogen) deposits and macrophage infiltrates in dystrophic muscle of DMD patients. (A) Representative examples of fibrin(ogen) accumulation and αMβ2 co-staining in sections of muscle biopsies from DMD patients compared with healthy individuals. Scale bar: 25 µm. (B) The proposed model for the deleterious action of persistently deposited fibrin(ogen) in the dystrophic muscle ECM, after extravasation. Exacerbated deposition of fibrin(ogen) promotes inflammation-mediated muscle degeneration and regeneration via αMβ2 integrin engagement on macrophages thus inducing expression of pro-inflammatory cytokines, which in turn may negatively regulate satellite cell functions. Fibrin(ogen) may also directly impact on satellite cells functions through αVβ3 integrin binding.

Similar articles

Cited by

References

    1. Campbell K.P. Three muscular dystrophies: loss of cytoskeleton-extracellular matrix linkage. Cell. 1995;80:675–679. doi:10.1016/0092-8674(95)90344-5. - DOI - PubMed
    1. Sicinski P., Geng Y., Ryder-Cook A.S., Barnard E.A., Darlison M.G., Barnard P.J. The molecular basis of muscular dystrophy in the mdx mouse: a point mutation. Science. 1989;244:1578–1580. doi:10.1126/science.2662404. - DOI - PubMed
    1. Durbeej M., Campbell K.P. Muscular dystrophies involving the dystrophin-glycoprotein complex: an overview of current mouse models. Curr. Opin. Genet. Dev. 2002;12:349–361. doi:10.1016/S0959-437X(02)00309-X. - DOI - PubMed
    1. Tidball J.G. Mechanical signal transduction in skeletal muscle growth and adaptation. J. Appl. Physiol. 2005;98:1900–1908. doi:10.1152/japplphysiol.01178.2004. - DOI - PubMed
    1. Stedman H.H., Sweeney H.L., Shrager J.B., Maguire H.C., Panettieri R.A., Petrof B., Narusawa M., Leferovich J.M., Sladky J.T., Kelly A.M. The mdx mouse diaphragm reproduces the degenerative changes of Duchenne muscular dystrophy. Nature. 1991;352:536–539. doi:10.1038/352536a0. - DOI - PubMed

Publication types

MeSH terms