

Panobinostat (LBH589)-induced acetylation of tubulin impairs megakaryocyte maturation and platelet formation
- PMID: 22381681
- PMCID: PMC3381910
- DOI: 10.1016/j.exphem.2012.02.004
Panobinostat (LBH589)-induced acetylation of tubulin impairs megakaryocyte maturation and platelet formation
Abstract
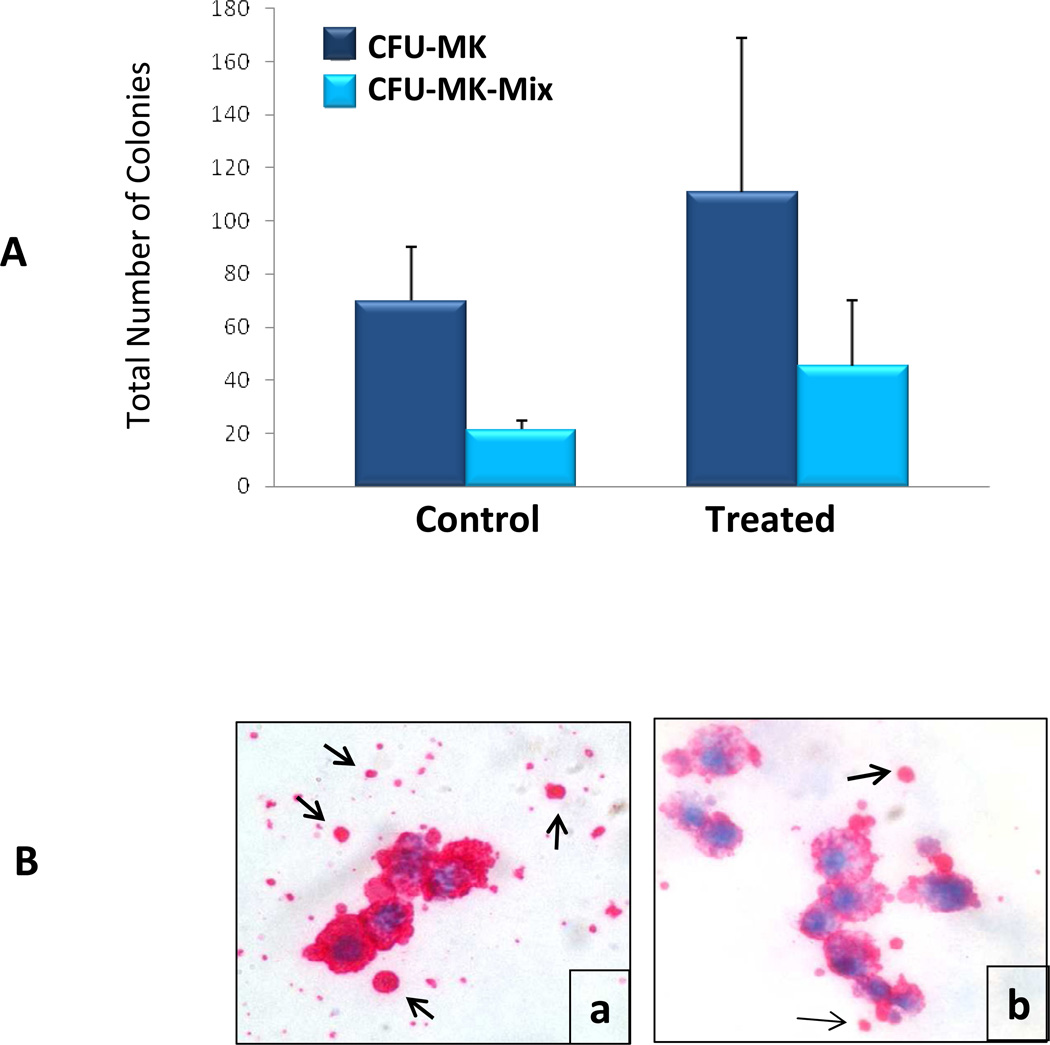
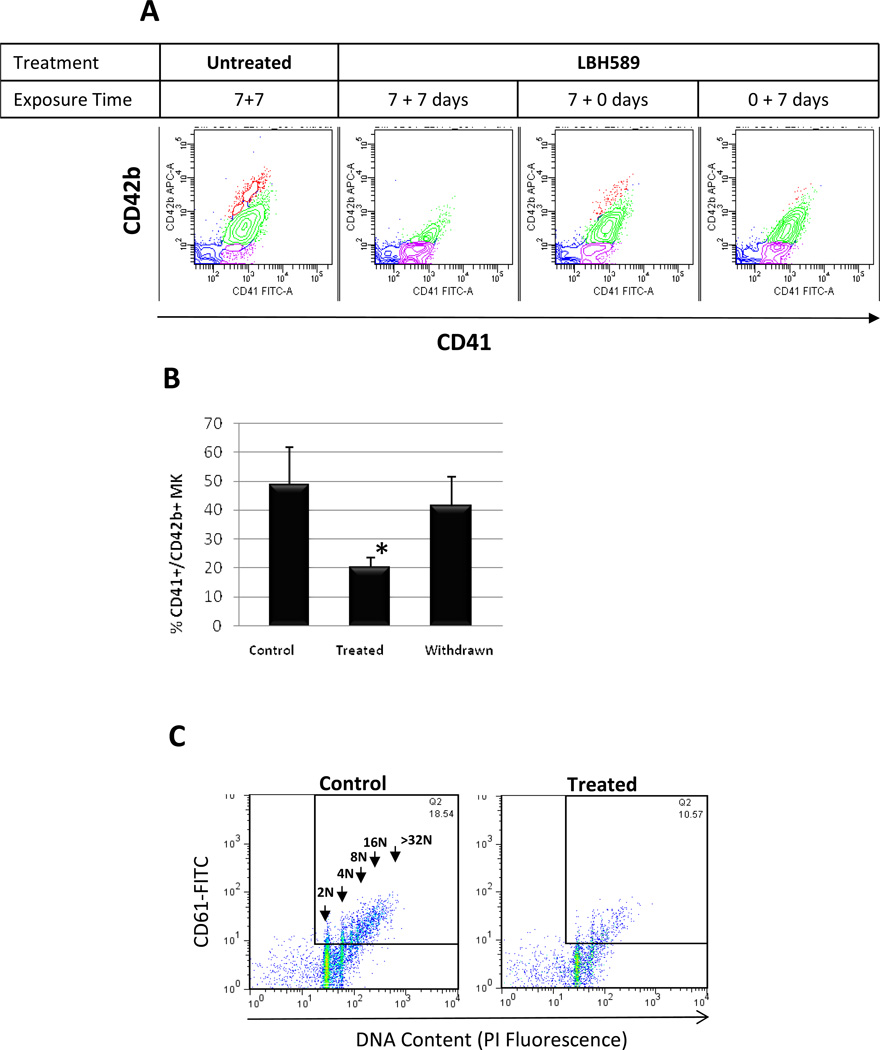
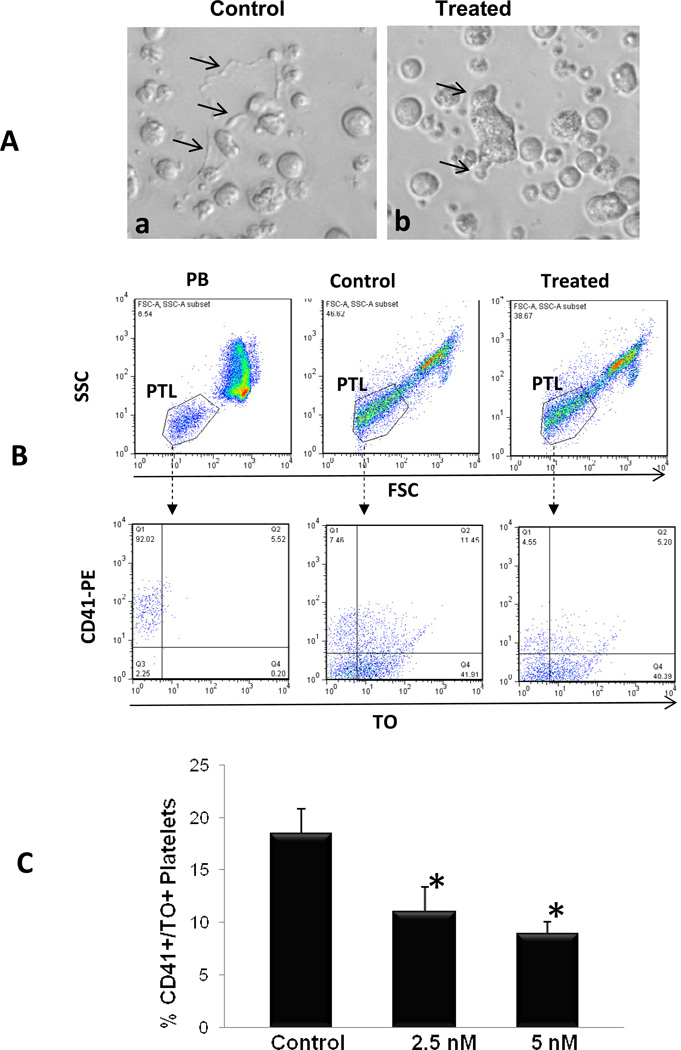
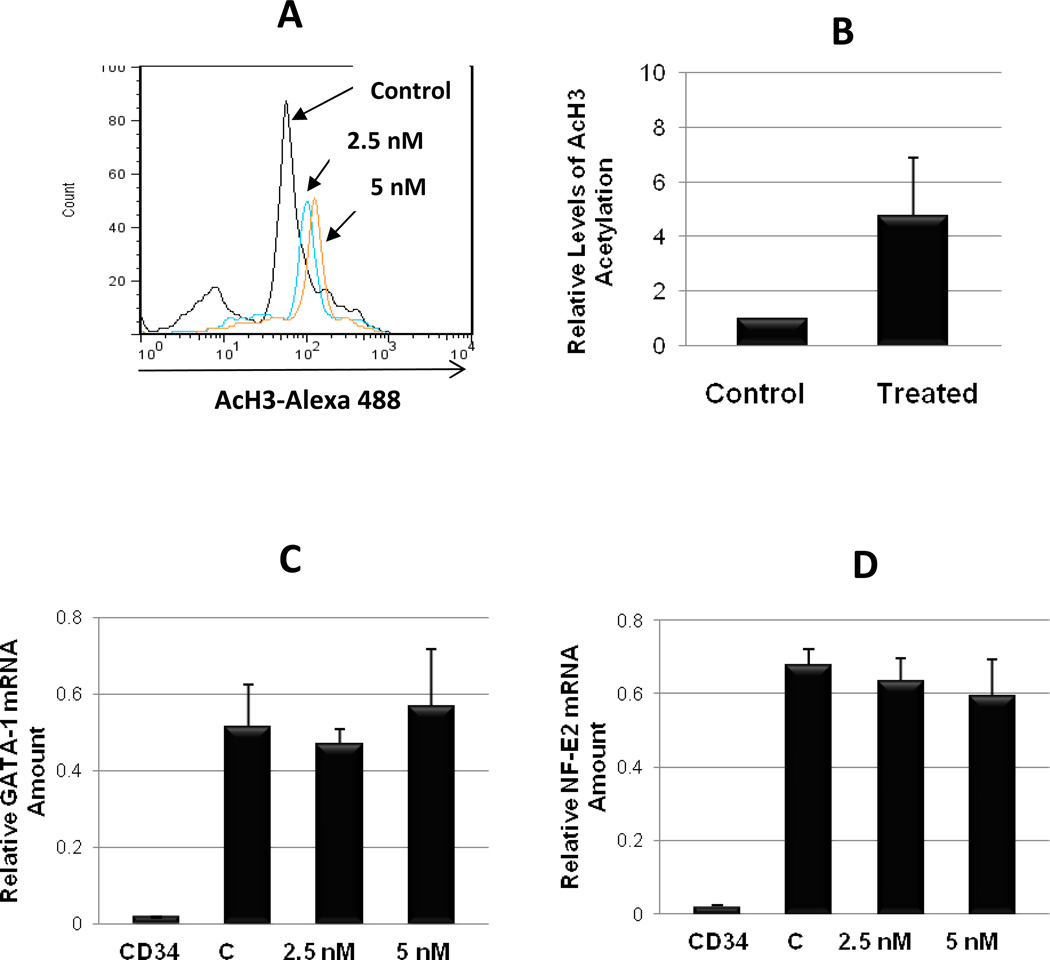
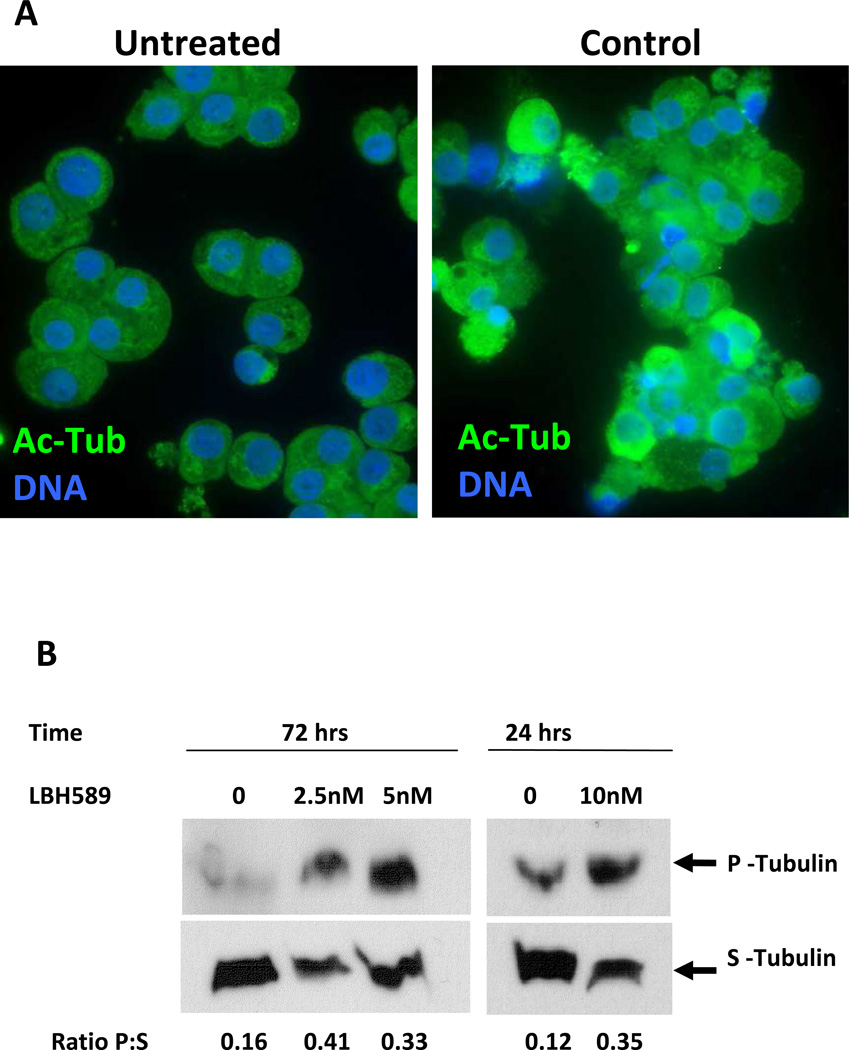
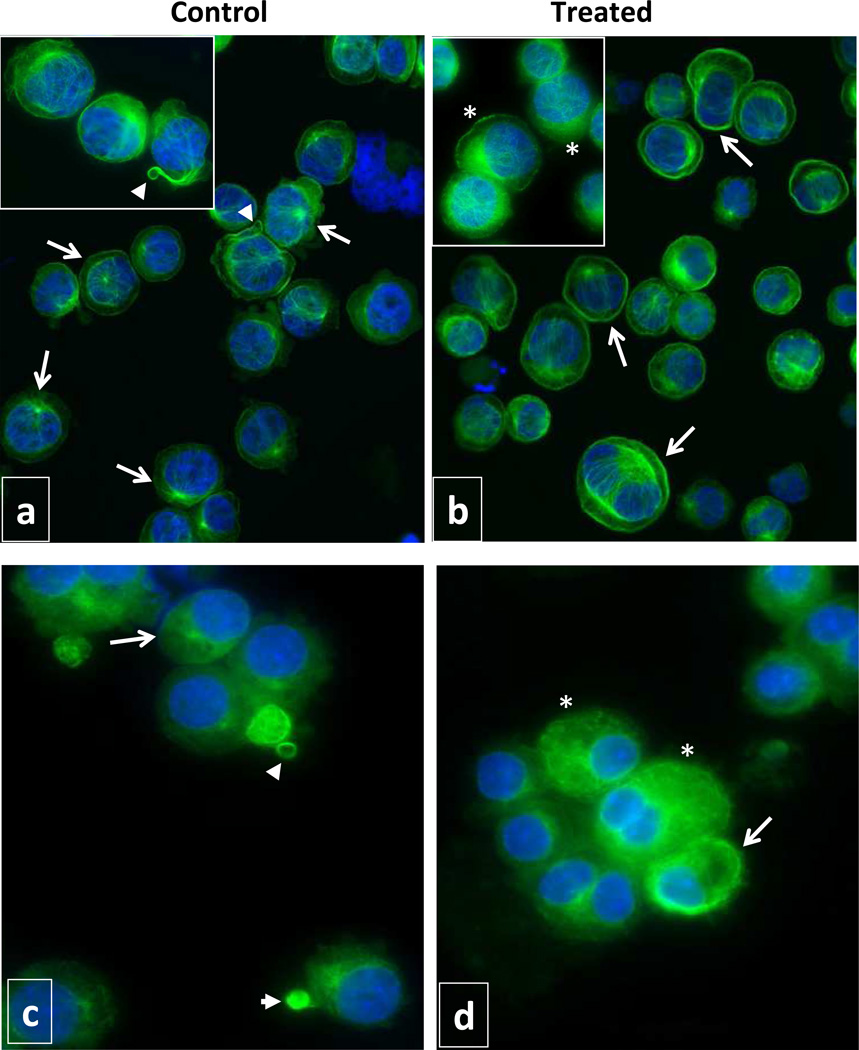
Drug-induced thrombocytopenia often results from dysregulation of normal megakaryocytopoiesis. In this study, we investigated the mechanisms responsible for thrombocytopenia associated with the use of Panobinostat (LBH589), a histone deacetylase inhibitor with promising anti-cancer activities. The effects of LBH589 were tested on the cellular and molecular aspects of megakaryocytopoiesis by utilizing an ex vivo system in which mature megakaryocytes (MK) and platelets were generated from human primary CD34(+) cells. We demonstrated that LBH589 did not affect MK proliferation or lineage commitment but inhibited MK maturation and platelet formation. Although LBH589 treatment of primary MK resulted in hyperacetylation of histones, it did not interfere with the expression of genes that play important roles during megakaryocytopoiesis. Instead, we found that LBH589 induced post-translational modifications of tubulin, a nonhistone protein that is the major component of the microtubule cytoskeleton. We then demonstrated that LBH589 treatment induced hyperacetylation of tubulin and alteration of microtubule dynamics and organization required for proper MK maturation and platelet formation. This study provides new insights into the mechanisms underlying LBH589-induced thrombocytopenia and provides a rationale for using tubulin as a target for selective histone deacetylase inhibitor therapies to treat thrombocytosis in patients with myeloproliferative neoplasms.
Copyright © 2012 ISEH - Society for Hematology and Stem Cells. Published by Elsevier Inc. All rights reserved.
Figures
Similar articles
-
HDACI-induced thrombocytopenia is caused by its unexpected target.Exp Hematol. 2012 Sep;40(9):695-7. doi: 10.1016/j.exphem.2012.07.001. Epub 2012 Jul 4. Exp Hematol. 2012. PMID: 22771790 No abstract available.
-
Cytotoxic activity of the histone deacetylase inhibitor panobinostat (LBH589) in anaplastic thyroid cancer in vitro and in vivo.Int J Cancer. 2012 Feb 1;130(3):694-704. doi: 10.1002/ijc.26057. Epub 2011 May 5. Int J Cancer. 2012. PMID: 21400508
-
Critical role of the HDAC6-cortactin axis in human megakaryocyte maturation leading to a proplatelet-formation defect.Nat Commun. 2017 Nov 27;8(1):1786. doi: 10.1038/s41467-017-01690-2. Nat Commun. 2017. PMID: 29176689 Free PMC article.
-
Development of the pan-DAC inhibitor panobinostat (LBH589): successes and challenges.Cancer Lett. 2009 Aug 8;280(2):233-41. doi: 10.1016/j.canlet.2009.02.019. Epub 2009 Apr 2. Cancer Lett. 2009. PMID: 19344997 Review.
-
Megakaryocyte modification of platelets in thrombocytopenia.Curr Opin Hematol. 2018 Sep;25(5):410-415. doi: 10.1097/MOH.0000000000000451. Curr Opin Hematol. 2018. PMID: 29985173 Review.
Cited by
-
Thrombocytopenia induced by the histone deacetylase inhibitor abexinostat involves p53-dependent and -independent mechanisms.Cell Death Dis. 2013 Jul 25;4(7):e738. doi: 10.1038/cddis.2013.260. Cell Death Dis. 2013. PMID: 23887629 Free PMC article.
-
Rediscovering hemostasis abnormalities in multiple myeloma: The new era.Heliyon. 2024 Jul 4;10(13):e34111. doi: 10.1016/j.heliyon.2024.e34111. eCollection 2024 Jul 15. Heliyon. 2024. PMID: 39055831 Free PMC article. Review.
-
Tubulin acetyltransferases access and modify the microtubule luminal K40 residue through anchors in taxane-binding pockets.Nat Struct Mol Biol. 2025 Feb;32(2):358-368. doi: 10.1038/s41594-024-01406-3. Epub 2024 Nov 4. Nat Struct Mol Biol. 2025. PMID: 39496813
-
AGBL2 promotes renal cell carcinoma cells proliferation and migration via α-tubulin detyrosination.Heliyon. 2024 Sep 4;10(18):e37086. doi: 10.1016/j.heliyon.2024.e37086. eCollection 2024 Sep 30. Heliyon. 2024. PMID: 39315218 Free PMC article.
-
Current and emerging treatment options for patients with relapsed myeloma.Clin Med Insights Oncol. 2013 Aug 19;7:209-19. doi: 10.4137/CMO.S8014. Clin Med Insights Oncol. 2013. PMID: 24179412 Free PMC article. Review.
References
-
- Chang Y, Bluteau D, Debili N, Vainchenker W. From hematopoietic stem cells to platelets. J Thromb Haemost. 2007;5:318–327. - PubMed
-
- Prince HM, Bishton MJ, Johnstone RW. Panobinostat (LBH589): a potent pan-deacetylase inhibitor with promising activity against hematologic and solid tumors. Future Oncol. 2009;5:601–612. - PubMed
Publication types
MeSH terms
Substances
Grants and funding
LinkOut - more resources
Full Text Sources
Other Literature Sources
