

Laue crystal structure of Shewanella oneidensis cytochrome c nitrite reductase from a high-yield expression system
- PMID: 22382353
- PMCID: PMC3412176
- DOI: 10.1007/s00775-012-0885-0
Laue crystal structure of Shewanella oneidensis cytochrome c nitrite reductase from a high-yield expression system
Abstract
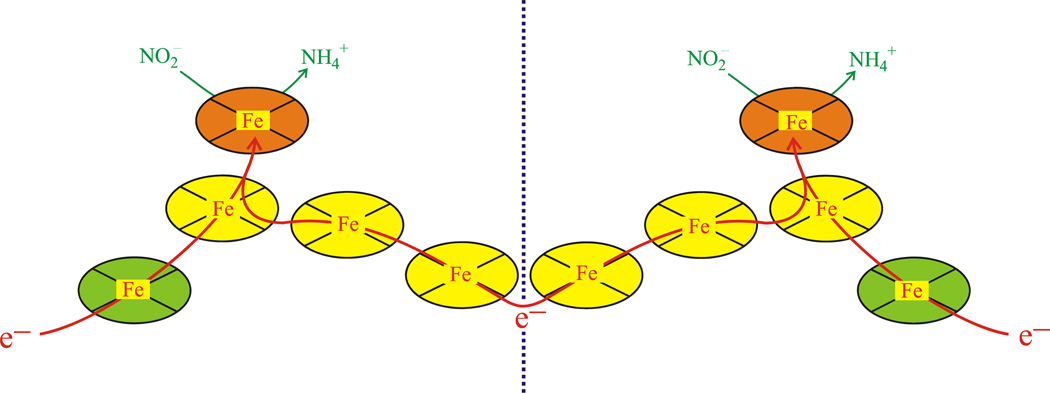
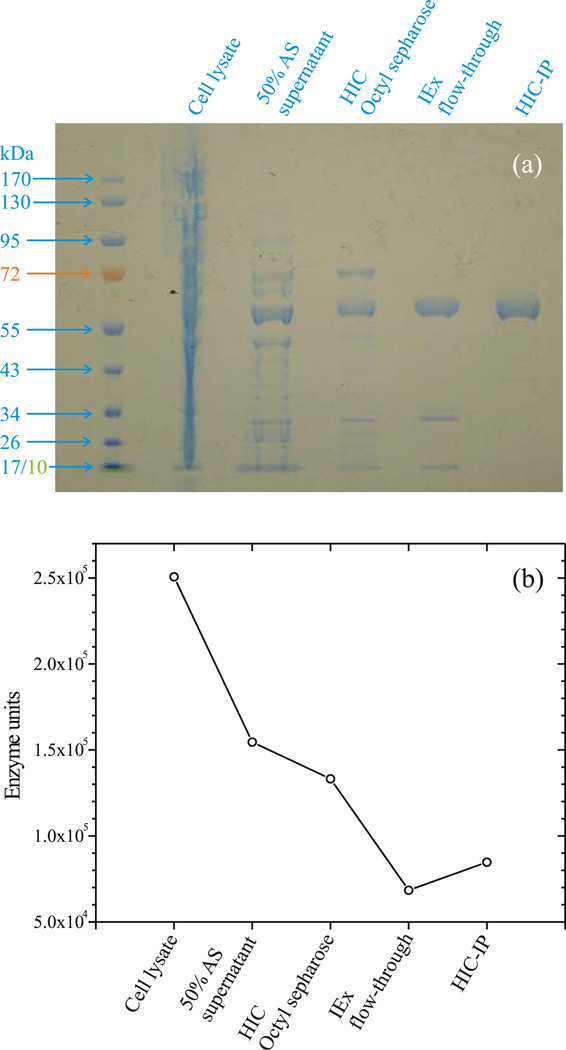
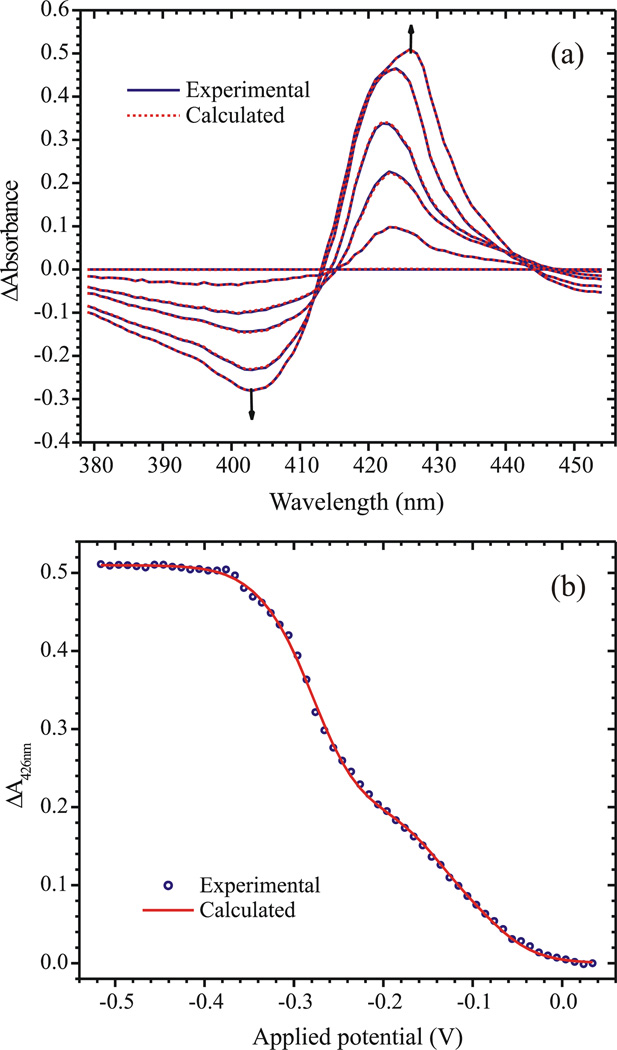
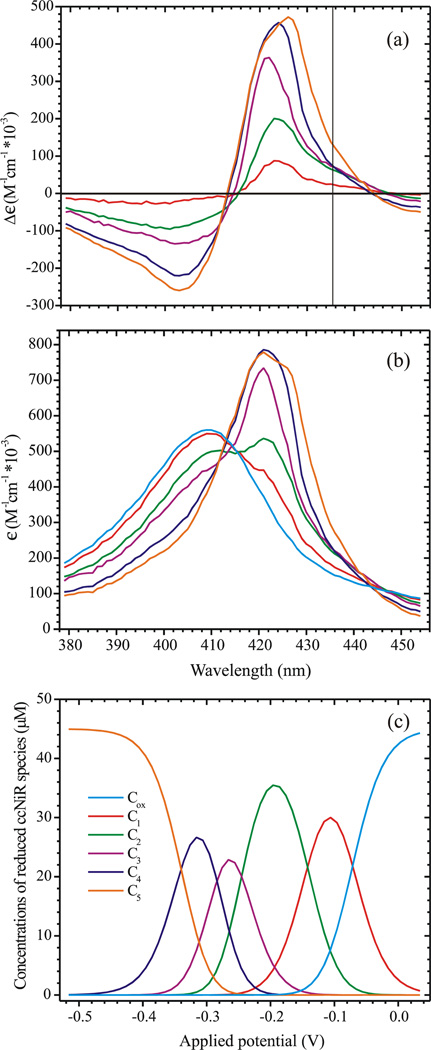
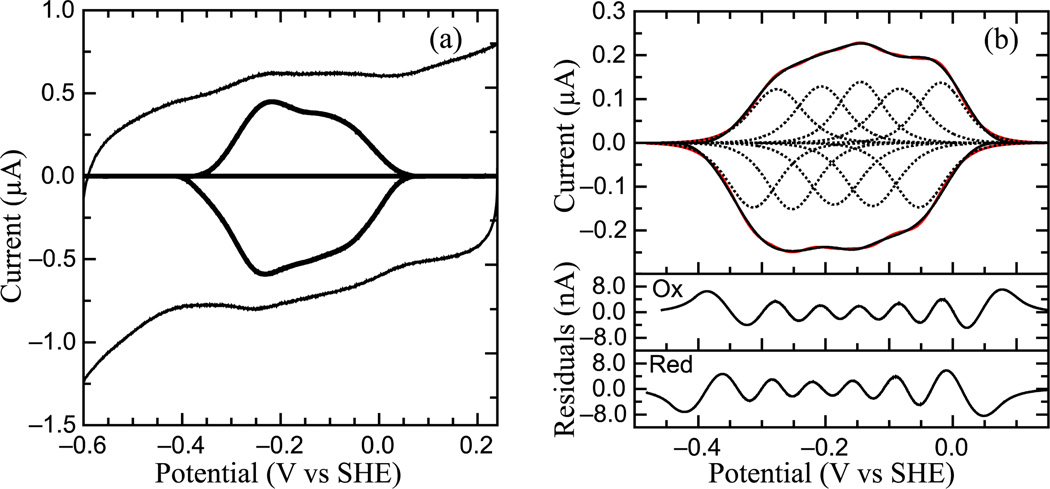
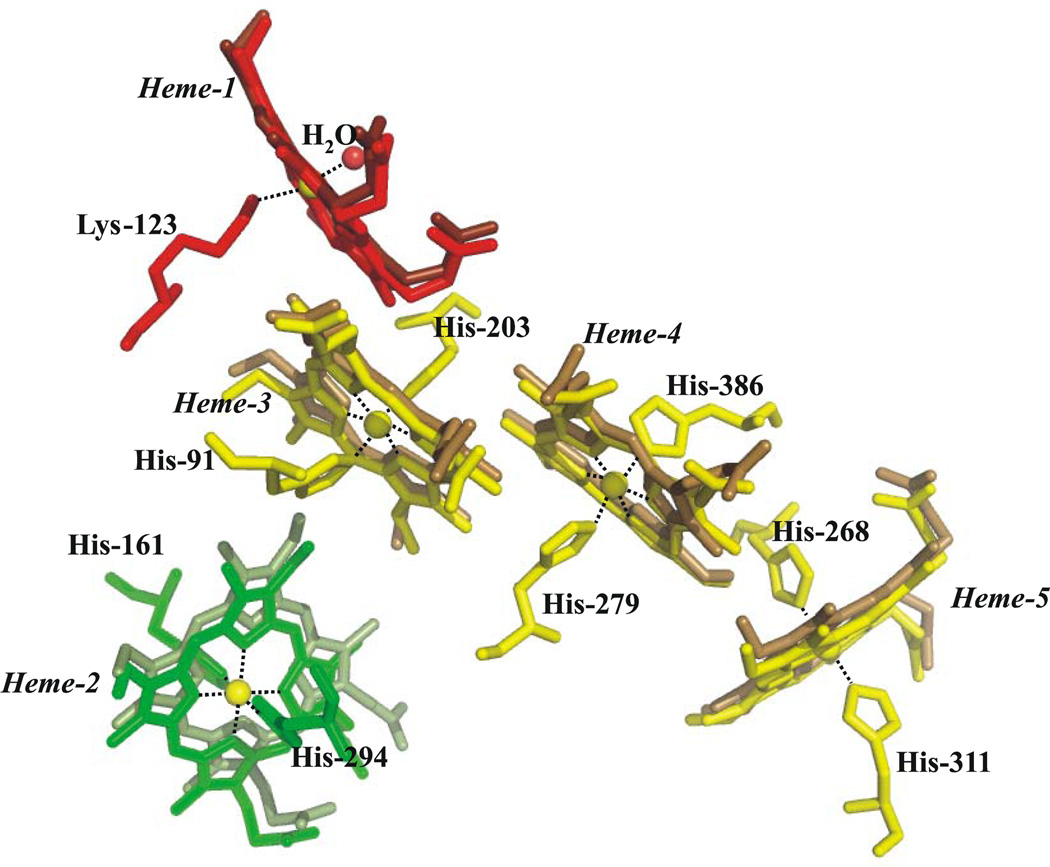
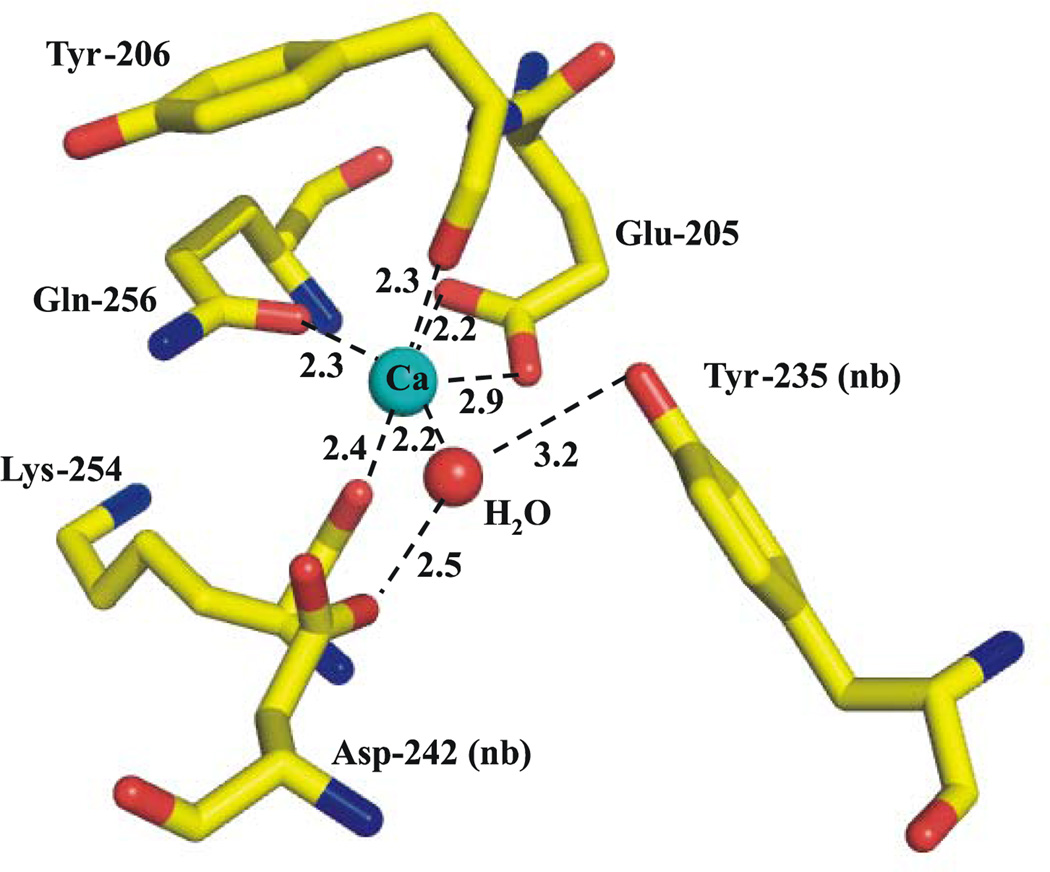
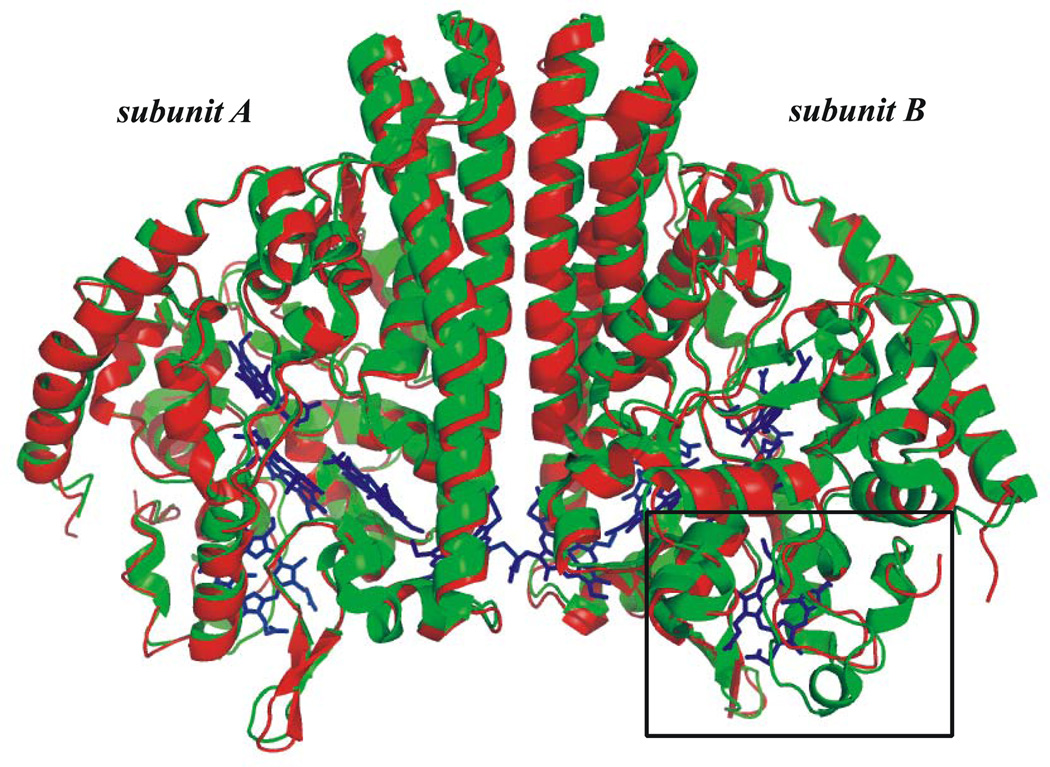
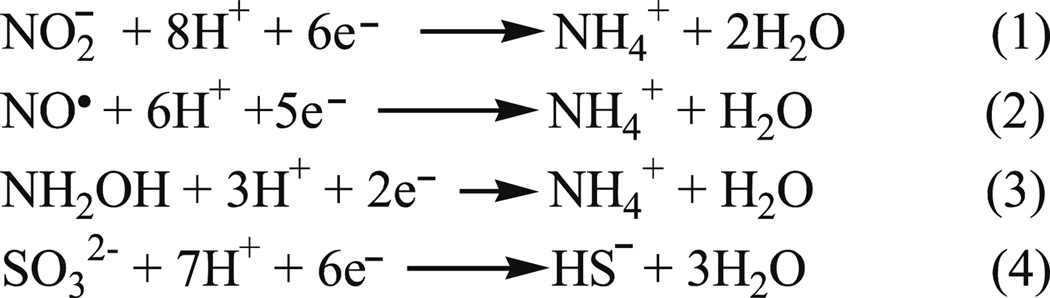
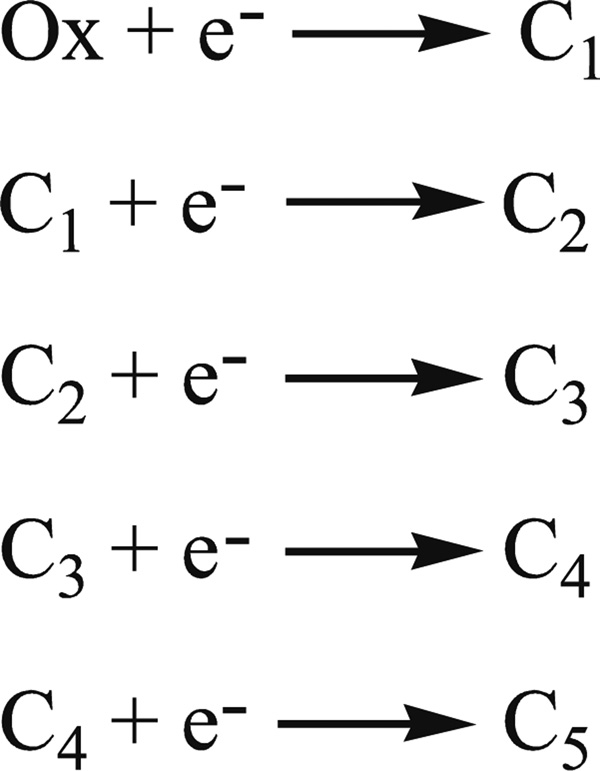
The high-yield expression and purification of Shewanella oneidensis cytochrome c nitrite reductase (ccNiR) and its characterization by a variety of methods, notably Laue crystallography, are reported. A key component of the expression system is an artificial ccNiR gene in which the N-terminal signal peptide from the highly expressed S. oneidensis protein "small tetraheme c" replaces the wild-type signal peptide. This gene, inserted into the plasmid pHSG298 and expressed in S. oneidensis TSP-1 strain, generated approximately 20 mg crude ccNiR per liter of culture, compared with 0.5-1 mg/L for untransformed cells. Purified ccNiR has nitrite and hydroxylamine reductase activities comparable to those previously reported for Escherichia coli ccNiR, and is stable for over 2 weeks in pH 7 solution at 4 °C. UV/vis spectropotentiometric titrations and protein film voltammetry identified five independent one-electron reduction processes. Global analysis of the spectropotentiometric data also allowed determination of the extinction coefficient spectra for the five reduced ccNiR species. The characteristics of the individual extinction coefficient spectra suggest that, within each reduced species, the electrons are distributed among the various hemes, rather than being localized on specific heme centers. The purified ccNiR yielded good-quality crystals, with which the 2.59-Å-resolution structure was solved at room temperature using the Laue diffraction method. The structure is similar to that of E. coli ccNiR, except in the region where the enzyme interacts with its physiological electron donor (CymA in the case of S. oneidensis ccNiR, NrfB in the case of the E. coli protein).
© SBIC 2012
Figures
Similar articles
-
Correlations between the Electronic Properties of Shewanella oneidensis Cytochrome c Nitrite Reductase (ccNiR) and Its Structure: Effects of Heme Oxidation State and Active Site Ligation.Biochemistry. 2015 Jun 23;54(24):3749-58. doi: 10.1021/acs.biochem.5b00330. Epub 2015 Jun 12. Biochemistry. 2015. PMID: 26042961 Free PMC article.
-
Trapping of a Putative Intermediate in the Cytochrome c Nitrite Reductase (ccNiR)-Catalyzed Reduction of Nitrite: Implications for the ccNiR Reaction Mechanism.J Am Chem Soc. 2019 Aug 28;141(34):13358-13371. doi: 10.1021/jacs.9b03036. Epub 2019 Aug 19. J Am Chem Soc. 2019. PMID: 31381304
-
Shewanella oneidensis cytochrome c nitrite reductase (ccNiR) does not disproportionate hydroxylamine to ammonia and nitrite, despite a strongly favorable driving force.Biochemistry. 2014 Apr 8;53(13):2136-44. doi: 10.1021/bi401705d. Epub 2014 Mar 28. Biochemistry. 2014. PMID: 24645742 Free PMC article.
-
Escherichia coli cytochrome c nitrite reductase NrfA.Methods Enzymol. 2008;437:63-77. doi: 10.1016/S0076-6879(07)37004-3. Methods Enzymol. 2008. PMID: 18433623 Review.
-
Pentahaem cytochrome c nitrite reductase: reaction with hydroxylamine, a potential reaction intermediate and substrate.Biochem Soc Trans. 2002 Aug;30(4):649-53. doi: 10.1042/bst0300649. Biochem Soc Trans. 2002. PMID: 12196156 Review.
Cited by
-
Contrasting catalytic profiles of multiheme nitrite reductases containing CxxCK heme-binding motifs.J Biol Inorg Chem. 2013 Aug;18(6):655-67. doi: 10.1007/s00775-013-1011-7. Epub 2013 Jun 16. J Biol Inorg Chem. 2013. PMID: 23771821
-
Multi-heme proteins: nature's electronic multi-purpose tool.Biochim Biophys Acta. 2013 Aug-Sep;1827(8-9):938-48. doi: 10.1016/j.bbabio.2013.03.010. Epub 2013 Apr 2. Biochim Biophys Acta. 2013. PMID: 23558243 Free PMC article. Review.
-
Multi-haem cytochromes in Shewanella oneidensis MR-1: structures, functions and opportunities.J R Soc Interface. 2015 Jan 6;12(102):20141117. doi: 10.1098/rsif.2014.1117. J R Soc Interface. 2015. PMID: 25411412 Free PMC article. Review.
-
Trichlorobacter ammonificans, a dedicated acetate-dependent ammonifier with a novel module for dissimilatory nitrate reduction to ammonia.ISME J. 2023 Oct;17(10):1639-1648. doi: 10.1038/s41396-023-01473-2. Epub 2023 Jul 13. ISME J. 2023. PMID: 37443340 Free PMC article.
-
The kinetic dose limit in room-temperature time-resolved macromolecular crystallography.J Synchrotron Radiat. 2012 Mar;19(Pt 2):264-73. doi: 10.1107/S090904951105549X. Epub 2012 Jan 18. J Synchrotron Radiat. 2012. PMID: 22338689 Free PMC article.
References
-
- Ehrlich HL. Geomicrobiology. New York, NY: Marcel Dekker, Inc; 2002.
-
- Einsle O, Messerschmidt A, Stach P, Bourenkov GP, Bartunik HD, Huber R, Kroneck PMH. Nature. 1999;400:476–480. - PubMed
-
- Einsle O, Stach P, Messerschmidt A, Simon J, Kroger A, Huber R, Kroneck PMH. J. Biol. Chem. 2000;275:39608–39616. - PubMed
-
- Pereira I, LeGall J, Xavier A, Teixeira M. Biochim. Biophys. Acta. 2000;1481:119–130. - PubMed
Publication types
MeSH terms
Substances
Grants and funding
LinkOut - more resources
Full Text Sources
Molecular Biology Databases
Miscellaneous
