

Characterizing a neurodegenerative syndrome: primary progressive apraxia of speech
- PMID: 22382356
- PMCID: PMC3338923
- DOI: 10.1093/brain/aws032
Characterizing a neurodegenerative syndrome: primary progressive apraxia of speech
Abstract
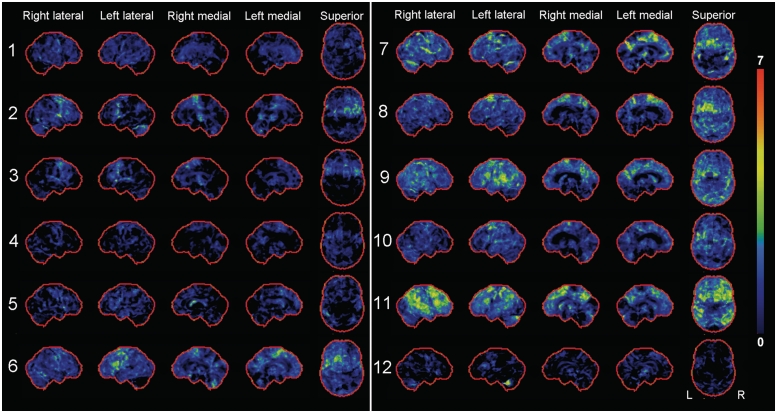
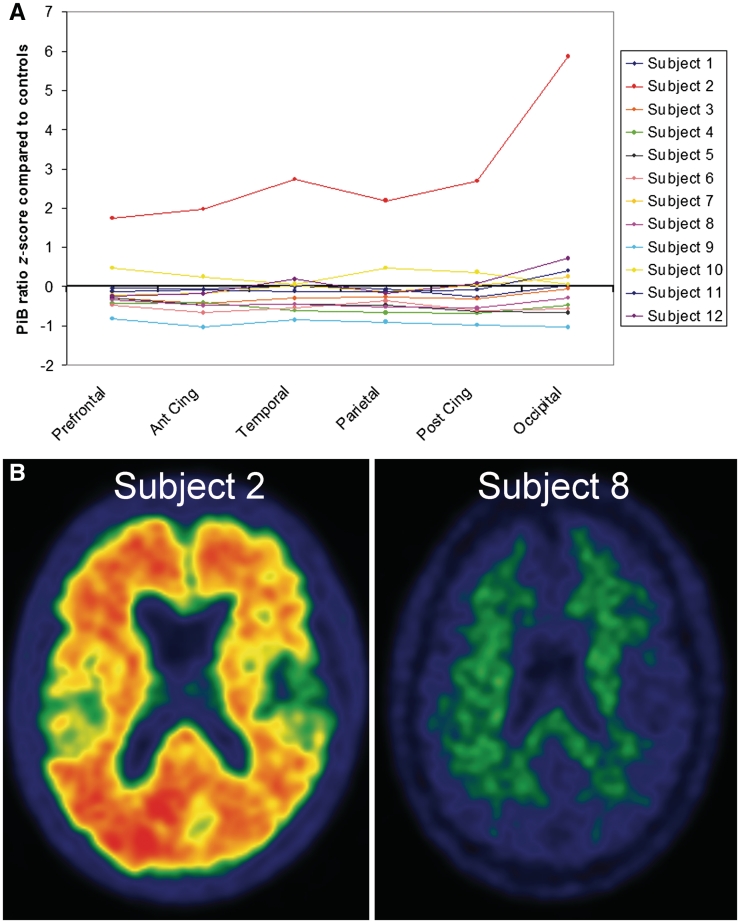
Apraxia of speech is a disorder of speech motor planning and/or programming that is distinguishable from aphasia and dysarthria. It most commonly results from vascular insults but can occur in degenerative diseases where it has typically been subsumed under aphasia, or it occurs in the context of more widespread neurodegeneration. The aim of this study was to determine whether apraxia of speech can present as an isolated sign of neurodegenerative disease. Between July 2010 and July 2011, 37 subjects with a neurodegenerative speech and language disorder were prospectively recruited and underwent detailed speech and language, neurological, neuropsychological and neuroimaging testing. The neuroimaging battery included 3.0 tesla volumetric head magnetic resonance imaging, [(18)F]-fluorodeoxyglucose and [(11)C] Pittsburg compound B positron emission tomography scanning. Twelve subjects were identified as having apraxia of speech without any signs of aphasia based on a comprehensive battery of language tests; hence, none met criteria for primary progressive aphasia. These subjects with primary progressive apraxia of speech included eight females and four males, with a mean age of onset of 73 years (range: 49-82). There were no specific additional shared patterns of neurological or neuropsychological impairment in the subjects with primary progressive apraxia of speech, but there was individual variability. Some subjects, for example, had mild features of behavioural change, executive dysfunction, limb apraxia or Parkinsonism. Voxel-based morphometry of grey matter revealed focal atrophy of superior lateral premotor cortex and supplementary motor area. Voxel-based morphometry of white matter showed volume loss in these same regions but with extension of loss involving the inferior premotor cortex and body of the corpus callosum. These same areas of white matter loss were observed with diffusion tensor imaging analysis, which also demonstrated reduced fractional anisotropy and increased mean diffusivity of the superior longitudinal fasciculus, particularly the premotor components. Statistical parametric mapping of the [(18)F]-fluorodeoxyglucose positron emission tomography scans revealed focal hypometabolism of superior lateral premotor cortex and supplementary motor area, although there was some variability across subjects noted with CortexID analysis. [(11)C]-Pittsburg compound B positron emission tomography binding was increased in only one of the 12 subjects, although it was unclear whether the increase was actually related to the primary progressive apraxia of speech. A syndrome characterized by progressive pure apraxia of speech clearly exists, with a neuroanatomic correlate of superior lateral premotor and supplementary motor atrophy, making this syndrome distinct from primary progressive aphasia.
Figures


References
-
- Abe K, Ukita H, Yanagihara T. Imaging in primary progressive aphasia. Neuroradiology. 1997;39:556–9. - PubMed
-
- Alajouanine T, Ombredane A, Durand M. Le syndrome de disintegration phonetique dans l’aphasie. Paris: Masson; 1939.
-
- Ashburner J, Friston KJ. Voxel-based morphometry—the methods. Neuroimage. 2000;11:805–21. - PubMed
-
- Ashburner J, Friston KJ. Unified segmentation. Neuroimage. 2005;26:839–51. - PubMed
-
- Bay E. Aphasia and non-verbal disorders of language. Brain. 1962;85:411–26. - PubMed
Publication types
MeSH terms
Substances
Grants and funding
LinkOut - more resources
Full Text Sources
Medical
Miscellaneous
