. 2012 Jun;14(2):206-17.
doi: 10.1208/s12248-012-9336-7. Epub 2012 Mar 2.

Conformational analysis of therapeutic proteins by hydroxyl radical protein footprinting

Affiliations

Conformational analysis of therapeutic proteins by hydroxyl radical protein footprinting

Caroline Watson et al. AAPS J. 2012 Jun.

Abstract

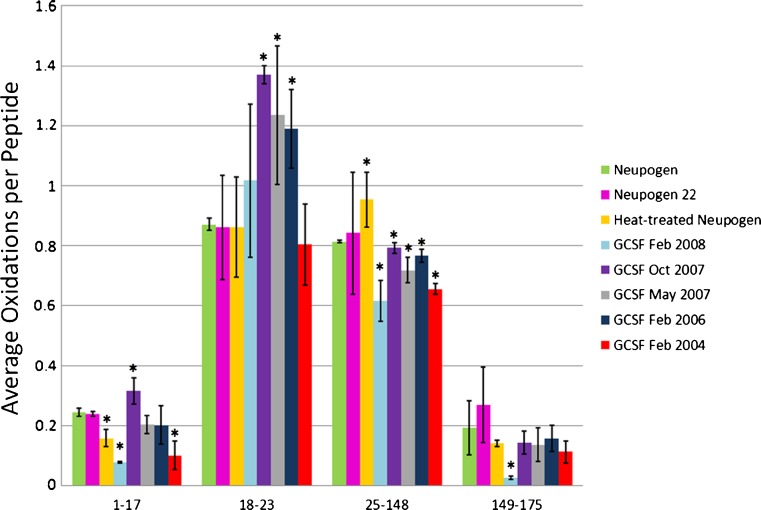
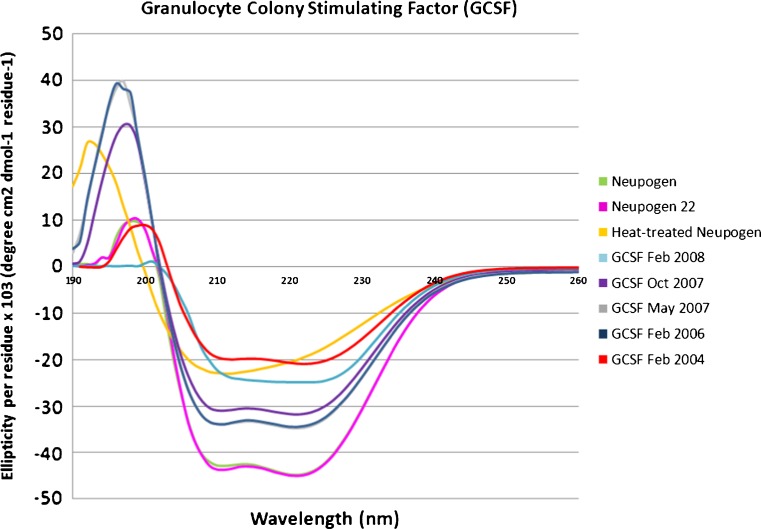
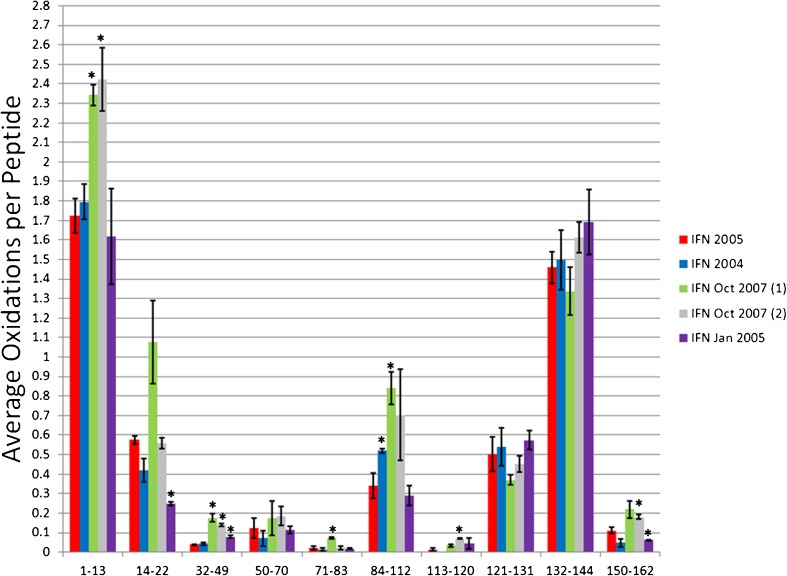
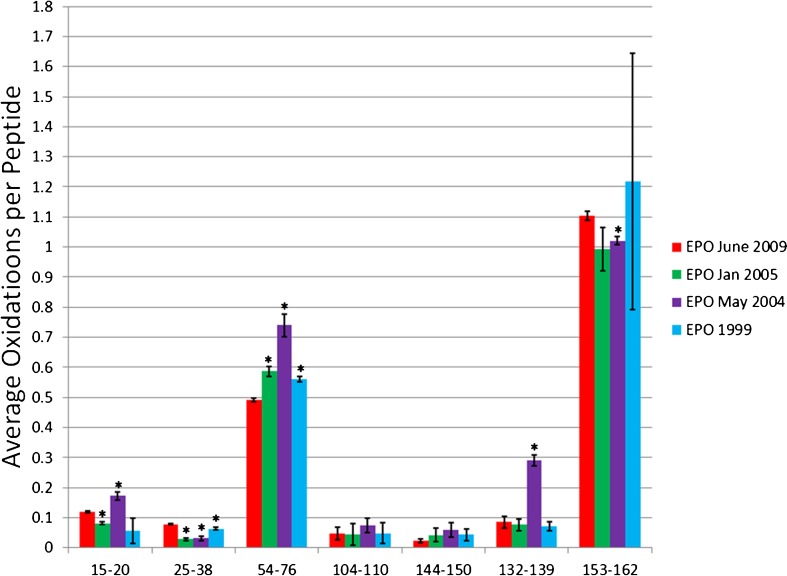
Unlike small molecule drugs, therapeutic protein pharmaceuticals must not only have the correct amino acid sequence and modifications, but also the correct conformation to ensure safety and efficacy. Here, we describe a method for comparison of therapeutic protein conformations by hydroxyl radical protein footprinting using liquid chromatography-mass spectrometry (LC-MS) as an analytical platform. Hydroxyl radical protein footprinting allows for rapid analysis of the conformation of therapeutic proteins based on the apparent rate of oxidation of various amino acids by hydroxyl radicals generated in situ. Conformations of Neupogen®, a patented granulocyte colony-stimulating factor (GCSF), were compared to several expired samples of recombinant GCSF, as well as heat-treated Neupogen®. Conformations of different samples of the therapeutic proteins interferon α-2A and erythropoietin were also compared. Differences in the hydroxyl radical footprint were measured between Neupogen® and the expired or mishandled GCSF samples, and confirmed by circular dichroism spectroscopy. Samples that had identical circular dichroism spectra were also found to be indistinguishable by hydroxyl radical footprinting. The method is applicable to a wide variety of therapeutic proteins and formulations through the use of separations techniques to clean up the protein samples after radical oxidation. The reaction products are stable, allowing for flexibility in sample handling, as well as archiving and reanalysis of samples. Initial screening can be performed on small amounts of therapeutic protein with minimal training in LC-MS, but samples with structural differences from the reference can be more carefully analyzed by LC-MS/MS to attain higher spatial resolution, which can aid in engineering and troubleshooting.


Figures

Fig. 1
Fig. 1
Hydroxyl radical footprinting of GCSF samples. Each set of bars represents one peptide from Neupogen® (green), Neupogen22 (pink), heat-treated Neupogen® (yellow), or recombinant GCSF samples generated in Feb 2008 (light blue), Oct 2007 (purple), May 2007 (gray), Feb 2006 (navy), or Feb 2004 (red). The y-axis represents the average number of oxidation events per peptide in the sample. Error bars 2 SD from a triplicate set of FPOP oxidations and analyses. Asterisks peptides with oxidation levels that significantly different than Neupogen® (p ≤ 0.01)
Fig. 2
Fig. 2
Circular dichroism analysis of GCSF samples. The near-UV CD spectra are presented from Neupogen® (green), Neupogen22 (pink), heat-treated Neupogen® (yellow), or recombinant GCSF samples generated in Feb 2008 (light blue), Oct 2007 (purple), May 2007 (gray), Feb 2006 (navy), or Feb 2004 (red)
Fig. 3
Fig. 3
Hydroxyl radical footprinting of IFN samples. Each set of bars represents one peptide from recombinant IFN samples generated in 2005 (red), 2004 (blue), two samples from Oct 2007 (green and gray), and Jan 2005 (purple). The y-axis represents the average number of oxidation events per peptide in the sample. Error bars 2 SD from a triplicate set of FPOP oxidations and analyses. Asterisks peptides with oxidation levels that significantly different than IFN 2005 (p ≤ 0.01)
Fig. 4
Fig. 4
Circular dichroism analysis of IFN samples. The near-UV CD spectra are presented from recombinant IFN samples generated in 2005 (red), 2004 (blue), Oct 2007 (green), and Jan 2005 (purple)
Fig. 5
Fig. 5
Hydroxyl radical footprinting of EPO samples. Each set of bars represents one peptide from recombinant EPO samples generated in 2009 (red), Jan 2005 (green), May 2004 (purple), and 1999 (blue). The y-axis represents the average number of oxidation events per peptide in the sample. Error bars represent 2 SD from a triplicate set of FPOP oxidations and analyses. Asterisks peptides with oxidation levels that significantly different than EPO 2009 (p ≤ 0.01)
Fig. 6
Fig. 6
Circular dichroism analysis of EPO samples. The near-UV CD spectra are presented from recombinant EPO samples generated in 2009 (red), Jan 2005 (green), May 2004 (purple), and 1999 (blue)

Similar articles

Cited by

References

    1. Locatelli F, Del Vecchio L, Pozzoni P. Pure Red-cell aplasia “epidemic”—mystery completely revealed? Perit Dial Int. 2007;27(Supplement 2):S303–S307. - PubMed
    1. McKoy JM, Stonecash RE, Cournoyer D, Rossert J, Nissenson AR, Raisch DW, et al. Epoetin‐associated pure red cell aplasia: past, present, and future considerations. Transfusion. 2008;48(8):1754–1762. doi: 10.1111/j.1537-2995.2008.01749.x. - DOI - PMC - PubMed
    1. Kessler M, Goldsmith D, Schellekens H. Immunogenicity of biopharmaceuticals. Nephrol Dial Transplant. 2006;21(suppl 5):v9. doi: 10.1093/ndt/gfl476. - DOI - PubMed
    1. Srebalus Barnes CA, Lim A. Applications of mass spectrometry for the structural characterization of recombinant protein pharmaceuticals. Mass Spectrom Rev. 2007;26(3):370–388. doi: 10.1002/mas.20129. - DOI - PubMed
    1. Bobst CE, Abzalimov RR, Houde D, Kloczewiak M, Mhatre R, Berkowitz SA, et al. Detection and characterization of altered conformations of protein pharmaceuticals using complementary mass spectrometry-based approaches. Anal Chem. 2008;80(19):7473–7481. doi: 10.1021/ac801214x. - DOI - PMC - PubMed

Publication types

LinkOut - more resources