Review
. 2013 Apr;34(4):707-15.
doi: 10.3174/ajnr.A2968. Epub 2012 Mar 1.

Multimodality MR imaging findings of low-grade brain edema in hepatic encephalopathy

Affiliations
Review

Multimodality MR imaging findings of low-grade brain edema in hepatic encephalopathy

L J Zhang et al. AJNR Am J Neuroradiol. 2013 Apr.

Abstract

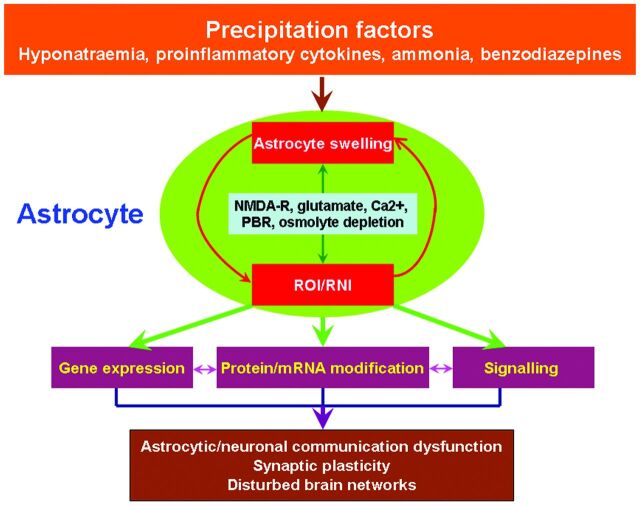
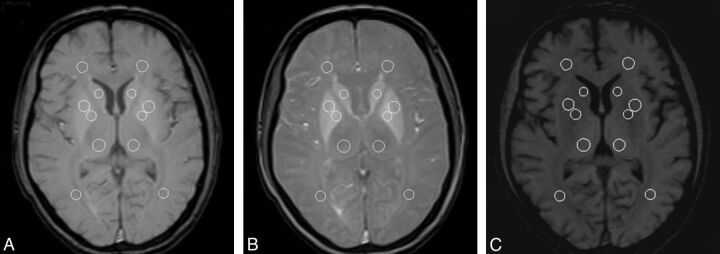
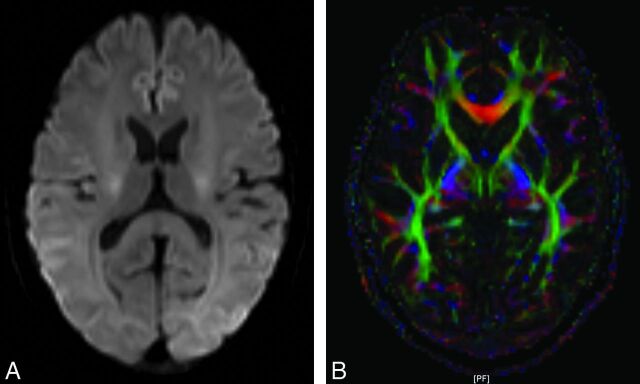
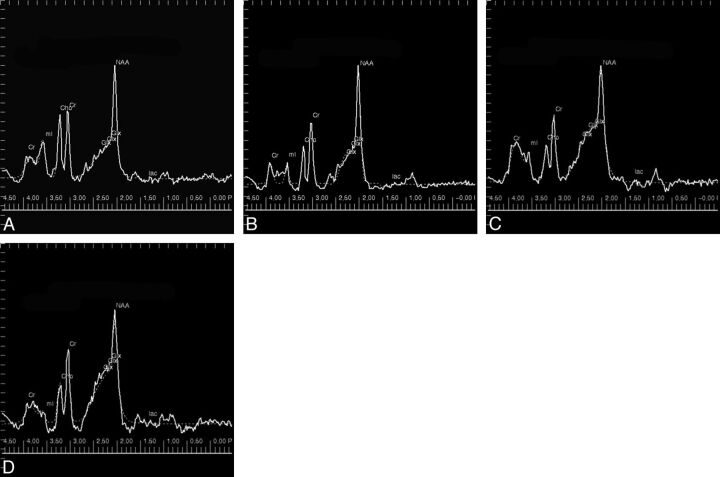
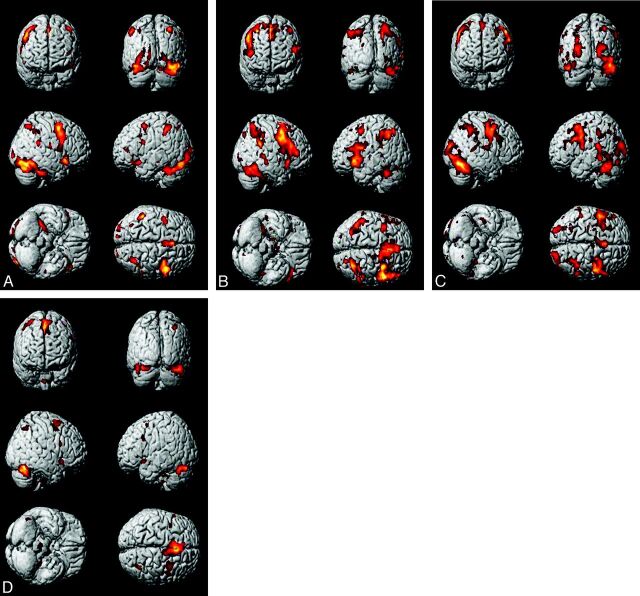
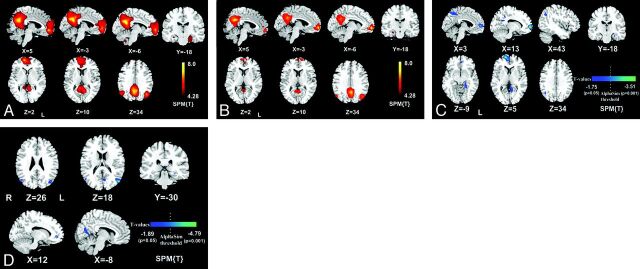
HE is a neuropsychiatric syndrome that develops in patients with severe liver diseases, with portosystemic shunt surgery in the form of diffuse mild brain edema. It is also associated with functional changes, such as those in attention and the DMN. MR imaging offers a range of capabilities for assessing the low-grade brain edema and its functional changes in brain affected by HE; therefore, it provides the opportunity to uncover the pathophysiologic mechanisms of HE. This article will review our current understanding of the pathophysiology of low-grade brain edema and will outline the role of structural MR imaging, MTR, DWI, DTI, and MR spectroscopy in the detection of low-grade brain edema, and the role of BOLD fMRI in the exploration of the related functional changes. A perspective of the study in this area will also be provided.


Figures

Fig. 1.
Fig. 1.
Low-grade brain edema in HE. Ammonia induces astrocyte swelling, which is, in part, counteracted by osmolyte depletion but can be aggravated by a set of precipitating factors. Astrocyte swelling involves activation of the N-methyl-D-aspartate receptor and the generation of reactive nitrogen oxide species, which again cause astrocyte swelling. The autoamplificatory loop produces signals that change the astrocyte function at multiple levels, including covalent modifications of proteins and ribonucleic acid, resulting in impaired glioneuronal communication, synaptic plasticity, and brain networks, which finally account for the symptoms of HE. Adapted with permission from Haussinger et al, with partial revision, and from BMJ Publishing Group Ltd. PBR indicates peripheral benzodiazepine receptor; RNI, reactive nitrogen intermediates; ROI, reactive oxygen intermediates.
Fig. 2.
Fig. 2.
Structural MR imaging findings in patients with cirrhosis. A, Axial T1-weighted image at the level of the basal ganglia shows symmetric high intensity in the bilateral basal ganglia. B, Corresponding axial T2-weighted image does not show abnormal findings. C, Coronal T2 FLAIR image shows multiple high signal intensities in or around the corticospinal tract.
Fig. 3.
Fig. 3.
MTI in a 37-year-old male patient with cirrhosis. A, MR image without the magnetic transfer saturation pulse. B, MR image with the magnetic transfer saturation pulse. C, MR image resulting from B minus A, in which changes of signal intensity reflect the signal intensity suppressed by magnetic transfer saturation pulse, correlating with macromolecule protein content in tissue. Some regions of interest for quantification of MTR are seen in these images.
Fig. 4.
Fig. 4.
DTI in 1 patient with cirrhosis, acquired with 3T MR imaging. DWI (A) and FA image (B), in which green represents fiber tracts along the anteroposterior; blue, caudocranial; and red, transverse direction.
Fig. 5.
Fig. 5.
A set of brain MR spectra of the right basal ganglia in patients with HE and healthy controls. A, 1H-MR spectroscopy of the right basal ganglia in a healthy adult. The main resonances correspond to NAA (2.0 ppm), glutamine/Glx (2.1–2.5 ppm), Cr/phosphocreatine (3.02 ppm), Cho (3.2 ppm), and mIns (3.55 ppm). B, 1H-MR spectroscopy of the right basal ganglia in a 25-year-old female patient with cirrhosis with Child-Pugh A and negative neuropsychological scores shows decreased mIns and Cho. C, 1H-MR spectroscopy of the right basal ganglia in a 44-year-old male patient with MHE with Child-Pugh B shows decreased mIns and Cho and increased Glx. D, 1H-MR spectroscopy of the right basal ganglia in a 70-year-old female patient with HE with Child-Pugh C shows decreased mIns and Cho and increased Glx. The spectra were collected by using a single-voxel point-resolved spectroscopic sequence on a 1.5T scanner.
Fig. 6.
Fig. 6.
fMRI studies of cognitive control in healthy patients and those with cirrhosis. A and B, Activated brain areas of healthy subjects performing word-reading and color-naming tasks, respectively. A, The word-reading task activates the following areas; bilateral middle frontal gyri (MFG), bilateral inferior frontal gyri (IFG), bilateral medial superior frontal gyri (MSFG), bilateral IPL, right superior parietal lobule (SPL), and bilateral temporal fusiform gyrus (TFG). B, The color-naming task shows more pronounced activation in above-mentioned brain areas. C and D, Activated brain areas of patients with cirrhosis performing word-reading and color-naming tasks, respectively. C, The word-reading task activates the following areas: the bilateral MFG, left MFG, right lateral superior frontal gyrus (SFG), left MSFG, bilateral precentral gyrus, bilateral parietal cortex, and bilateral TFG. D, The color-naming task shows that the activated brain areas are sparse and weaker.
Fig. 7.
Fig. 7.
DMN changes in patients with HE. A, DMN of the controls consists of bilateral precuneus/posterior cingulate cortex, medial prefrontal cortex, anterior cingulate cortex, angular gyri, and temporal pole (P < .05, FDR-corrected). B, DMN of the patients with HE consists of the bilateral precuneus/posterior cingulate cortex, medial prefrontal cortex, anterior cingulate cortex, angular gyri, and temporal pole (P < .05, FDR-corrected). Patterns in the patients with HE are similar but with reduced size compared with those of healthy subjects in. C, Differences between the DMN of the patients with HE and controls were in the left posterior cingulate cortex and bilateral precuneus, right angular gyrus, bilateral middle frontal cortex, and left parahippocampus (P < .05 for all, uncorrected) and in the right middle frontal gyrus and left posterior cingulate cortex (P < .05 corrected, combined height threshold P < .01 and a minimum cluster size of 24 voxels). D, Statistical t maps of the vein blood ammonia against z scores in ICA in the HE group. A negative correlation of the ICA z score with venous blood ammoniawas found in the right middle frontal gyrus, left posterior cingulate cortex, left parahippocampus, bilateral angular gyri (P < .05 for all, uncorrected), and the left angular gyrus color-coded bright blue (P < .05 corrected, combined height threshold P < .01 and a minimum cluster size of 24 voxels).

References

    1. Rovira A, Alonso J, Cordoba J. MR imaging findings in hepatic encephalopathy. AJNR Am J Neroradiol 2008;29:1612–21 - PMC - PubMed
    1. Matsusue E, Kinoshita T, Ohama E, et al. . Cerebral cortical and white matter lesions in chronic hepatic encephalopathy: MR-pathologic correlations. AJNR Am J Neuroradiol 2005;26:347–51 - PMC - PubMed
    1. Córdoba J. New assessment of hepatic encephalopathy. J Hepatol 2011;54:1030–40 - PubMed
    1. Poveda MJ, Bernabeu A, Concepción L, et al. . Brain edema dynamics in patients with overt hepatic encephalopathy: a magnetic resonance imaging study. Neuroimage 2010;52:481–87 - PubMed
    1. McPhail MJ, Taylor-Robinson SD. The role of magnetic resonance imaging and spectroscopy in hepatic encephalopathy. Metab Brain Dis 2010;25:65–72 - PubMed

Publication types

MeSH terms