Comparative Study
. 2012 Mar 1;19(3):126-41.
doi: 10.1101/lm.023499.111.

Bidirectional interactions between circadian entrainment and cognitive performance

Affiliations
Comparative Study

Bidirectional interactions between circadian entrainment and cognitive performance

Howard J Gritton et al. Learn Mem. .

Abstract

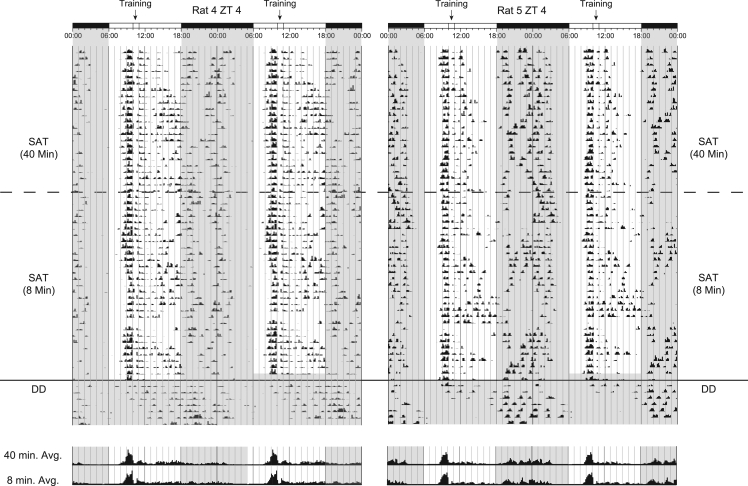
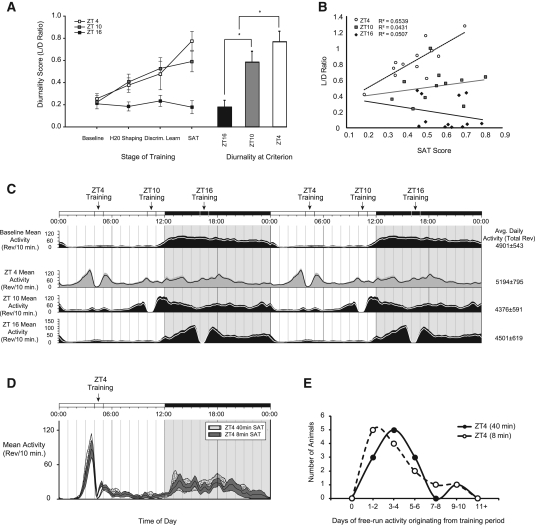
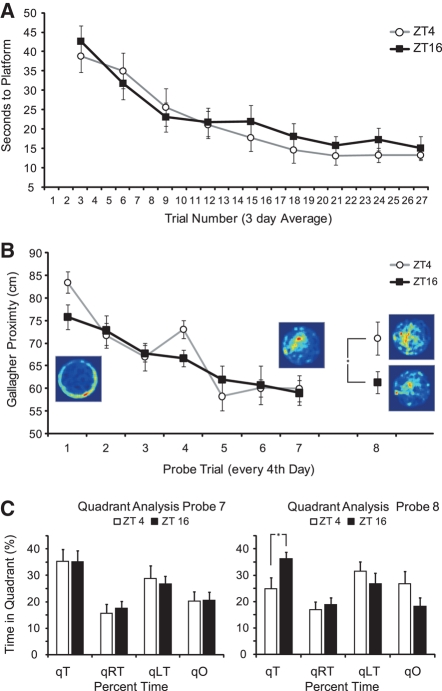
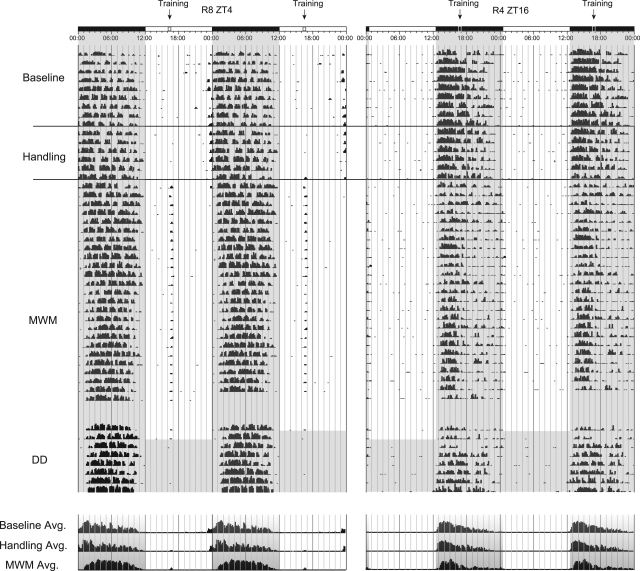
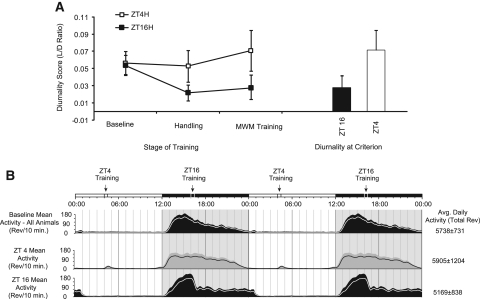
Circadian rhythms influence a variety of physiological and behavioral processes; however, little is known about how circadian rhythms interact with the organisms' ability to acquire and retain information about their environment. These experiments tested whether rats trained outside their endogenous active period demonstrate the same rate of acquisition, daily performance, and remote memory ability as their nocturnally trained counterparts in tasks of sustained attention and spatial memory. Furthermore, we explored how daily task training influenced circadian patterns of activity. We found that rats demonstrate better acquisition and performance on an operant task requiring attentional effort when trained during the dark-phase. Time of day did not affect acquisition or performance on the Morris water maze; however, when animals were retested 2 wk after their last day of training, they showed better remote memory if training originally occurred during the dark-phase. Finally, attentional, but not spatial, task performance during the light-phase promotes a shift toward diurnality and the synchronization of activity to the time of daily training; this shift was most robust when the demands on the cognitive control of attention were highest. Our findings support a theory of bidirectional interactions between cognitive performance and circadian processes and are consistent with the view that the circadian abnormalities associated with shift-work, aging, and neuropsychiatric illnesses may contribute to the deleterious effects on cognition often present in these populations. Furthermore, these findings suggest that time of day should be an important consideration for a variety of cognitive tasks principally used in psychological and neuroscience research.


Figures

Figure 1.
Figure 1.
Study design and timeline. (A) Training schedule for animals training on the sustained attention task or Morris water maze. All animals were maintained on a 12:12-h LD schedule with animals training at one of three training times (ZT4: 4 h after lights-on; ZT10: 10 h after lights-on; and ZT16: 4 h after lights-off). (B) Design for four experimental groups used in this study: Group I animals consisted of three different time-of-day SAT training groups. White bars represent training at ZT4, gray bars represent training at ZT10, black bars represent training at ZT16. Group II and Group IV animals consisted of animals training at ZT4 and ZT16 only. Group III animals trained on the SAT at ZT4 only. Group II animals had their training times reversed after reaching asymptotic performance. dSAT represents a challenge session where the middle 54 trials of a training session are performed in the presence of a flashing house-light as a distracter (see Materials and Methods and Fig. 3D, below, for illustration). Group III animals were trained to criterion on the SAT on the full version of the task (162 trials, ∼40 min). After reaching criterion, animals continued training for 30 additional days on an 8-min version of the task. Group IV animals were trained on the Morris water maze for a period of 28 d. Following training, animals were housed in constant darkness until the remote memory test 14 d later. Sustained attention task (SAT), distracter sustained attention task (dSAT).
Figure 2.
Figure 2.
Acquisition and criterion performance for Group I. (A) Days to criterion for individual animals plotted from longest to shortest for all SAT-trained animals by time of daily training (n = 36; 12 animals/group). (B) Mean days to criterion by training time ± SEM, (*) P < 0.05. Criterion performance is defined as the time needed for animals to reach 70% accuracy on nonsignal trials (correct rejections) and 70% accuracy on the longest signal duration trials (hits: 500 msec). (C) Correct rejection ratio and overall SAT score by training time ± SEM, (*) P < 0.05. SAT score provides a composite measure of performance that includes both signal and nonsignal trials across all three signal durations. A score of 0 represents chance performance or a complete lack of ability to discriminate between signal and nonsignal events, while a score of 1 represents perfect performance, with animals providing correct responses on every trial (see Materials and Methods). (D) SAT score by signal duration across all three training groups ± SEM, (*) P < 0.05. (SAT score = vigilance index [vi] at 500-msec, 50-msec, and 25-msec signal durations). (E) Mean number of days for animals to reach 90%–70% of their own asymptotic performance by group ± SEM, (*) P < 0.05. (F) Rate of acquisition relative to individual asymptotic performance. Figure plots number of days for animals to reach 90% of their asymptotic performance (x-axis) plotted against their SAT score on that date (y-axis). Slope represents the rate of acquisition for each population.
Figure 3.
Figure 3.
Time-of-day reversal training and dSAT performance for Group II. (A) SAT score of ZT16-trained animals by signal duration switched to training at ZT4. Baseline period consists of final 10 d of training at asymptotic performance. Interval between baseline and restarting training for both groups was 34 d. Reversal training continued for 30 d. (RV1) Reversal days 1–10, (RV2) reversal days 11–20, (RV3) reversal days 21–30. (Inset) Overall SAT score by 10-d periods ± SEM, (*) P < 0.05. (B) Baseline, (RV) reversal period. (B) SAT score of ZT4-trained animals by signal duration switched to training at ZT16. (C) History effect comparing performance of animals from before and after reversal of training time. SAT score by baseline and reversal periods 1–3 ± SEM, (*) P < 0.05. (D) dSAT performance for animals in Group II by block ± SEM, (*) P < 0.05. Blocks 1 and 3 consist of standard trial types. Block 2 consists of trials where distracter is present.
Figure 4.
Figure 4.
Representative double-plotted actograms for three animals training on the SAT. SAT training is relative to the topmost LD bar (where dark bar = lights-off), and the training marker represents the ∼40-min period in which animals are absent from their home cages during SAT training. Superimposed gray shading over the actogram marks periods where lights are off. Actograms are separated into two phases: The first phase represents a continuous 60 d, with the baseline period reflecting the first 10 plotted days. The dashed line denotes the onset of the water deprivation and a 3- or 4-d shaping phase (learning to press levers). The solid lines denote a variable training phase during which animals are introduced to discriminating between signal and nonsignal trials with the house-light off (discrimination learning). The following period represents training on the final version of the SAT and is characterized by a robust increase in anticipation for the daily training session and changes in nocturnal activity distribution. The hatched area represents the 3-d period in which this animal reaches criterion performance (see Results and Materials and Methods). The second phase of the actogram illustrates the final 2 d of SAT training and the first 7 d of activity under constant conditions after training had ceased (total darkness: DD). Note that activity continues at the time training would have normally occurred for several days after training had stopped under constant conditions. Time histograms at the bottom of each actogram represent averages of the daily bins of activity shown above from both baseline and SAT phases of training, with 48 h per line.
Figure 5.
Figure 5.
Double-plotted actograms for two Group III SAT-trained animals. Actograms represent the final 53 d of training and the first 7 d of activity after training had ceased under constant conditions. After reaching criterion on the full version of the task (40-min version), training was reduced to one block of trials (∼8-min version) and continued for 30 d. The dashed line denotes the onset of the abbreviated training paradigm. The solid line denotes the onset of the first 7 d of activity under constant conditions after training had ceased (total darkness: DD). Rat 4 showed particularly strong entrainment to the time of training with activity originating at the time training would have occurred over all 7 d shown. Rat 5 shows a more representative level of entrainment with activity persisting from the time training would have occurred for 3 d under constant conditions. Time histograms at the bottom of each actogram represent averages of the daily bins of activity shown above for the final 10 d of training under the full training paradigm (40 min) and the abbreviated training paradigm (8 min). Note the similarities in activity under either training condition suggesting duration of training is not a key factor in determining the amplitude of light-phase activity.
Figure 6.
Figure 6.
Mean activity ratios and effects of entrainment on performance. (A) Light–dark ratio of activity from animals across distinct stages of SAT training (left) and at criterion (right) for Group I animals (LD ratio ± SEM, (*) P < 0.05). (B) Correlation between performance (SAT score) at criterion and LD ratio. (C) Mean double-plotted histograms for all animals from Group I ± SEM: x-axis is plotted in zeitgeber time (ZT) and y-axis (left) represents wheel revolutions with activity grouped into 10-min bins. Mean total daily counts ± SEM are expressed on the right. Baseline activity represents activity from all animals prior to training. SAT training is relative to the topmost LD bar (dark bar = lights-off). ZT4 (white), ZT10 (gray), and ZT16 (black) mean histograms are taken from the last 10 d of the experiment with all animals at criterion performance. The inner line represents mean activity and upper shading represents SEM. (D) Mean histograms for animals from Group III ± SEM training at ZT4: x-axis is zeitgeber time and y-axis (left) is wheel revolutions in bins of 10 min. Hatched shading is mean daily activity for all animals from last 10 d of training on the 40-min version of the task ± SEM. Gray shading is mean daily activity from the same animals for the last 10 d of training on the abbreviated version of the task ± SEM. (E) Histogram demonstrating the distribution of free-run activity originating from the time training would have occurred under constant conditions for all animals within each training group (40 min vs. 8 min). All animals showed a minimum of at least 1 d of activity with one animal from each group showing as many as 9–10 d of activity (40-min mean = 3.83 ± 0.69 d; 8-min mean = 3.67 ± 0.74 d).
Figure 7.
Figure 7.
Morris water maze acquisition and remote memory. (A) Acquisition rate as measured by time to platform for all animals in the study grouped by time of training (ZT4, n = 8; ZT16, n = 8). Data were binned across 3 d and represents time in sec ± SEM. No significant differences were found between groups. (B) Probe trial performance as measured by average distance to platform during the 60-sec probe trial (Gallagher proximity) ± SEM, (*) P < 0.05. (Insets) Three-dimensional (3D) heat maps represent relative location density during probe trial (warm colors = higher density of activity, cooler colors = little or no time spent in that location). Heat maps for probe trials 1 and 7 combine location density for all animals (n = 16). Heat maps for probe trial 8 are separated by group: (top) ZT4 (n = 8), (bottom) ZT16 (n = 8). (C) Quadrant analysis during probe trials 7 and 8 ± SEM, (*) P < 0.05. Note nonsignificant differences for treatment groups for time spent in target quadrant on probe trial 7. During the remote memory test (probe trial 8), ZT4 animals returned to chance performance (∼25%), while ZT16 animals did not differ from their probe trial 7 performance. (qT) Target quadrant, (qO) quadrant opposite target, (qRT) quadrant to right of target, (qLT) quadrant to left of target.
Figure 8.
Figure 8.
Representative double-plotted actograms for animals training on the MWM. Training is relative to the topmost LD bar (where dark bar = lights-off) and the training marker represents the ∼20-min MWM training session in which animals are absent from their home cages (animals are moved to and from the testing area in groups of eight and tested one at a time). Superimposed gray shading over the actogram marks periods where lights are off. Actograms are separated into two phases: The first phase represents a continuous 40 d, with the baseline period reflecting the first 10 plotted days. The solid lines denote 1 wk of timed daily handling, with the remaining activity representing the first 24 d of the 28-d-long MWM training phase. The second phase of the actogram illustrates the final 2 d of MWM training and the first 7 d of activity under constant conditions after training had stopped (total darkness: DD). Time histograms at the bottom provide averages of the daily bins of activity shown above from both baseline and MWM training phases above.
Figure 9.
Figure 9.
Mean activity ratios across task training for animals on the MWM. (A) Light–dark activity ratio from animals during the baseline condition, 1 wk of timed daily handling, and 28 d of MWM training ± SEM (left). No significant differences were noted in LD ratio across the three phases tested. LD ratio for the MWM phase of testing is plotted on the right (±SEM). (B) Mean double-plotted histograms for all animals from MWM experiments (Group IV): x-axis is plotted in zeitgeber time (ZT) and y-axis represents wheel revolutions with activity grouped into 10-min bins (left). Mean total daily counts ± SEM are expressed on the right. Baseline activity represents activity from all animals prior to training. MWM training is relative to the topmost LD bar (dark bar = lights-off). ZT4 (white) and ZT16 (black) mean histograms are taken from the last 10 d of water maze training. Inner line represents mean activity and upper shading represents SEM.

Similar articles

Cited by

References

    1. Aguilar-Valles A, Sanchez E, de Gortari P, Balderas I, Ramirez-Amaya V, Bermudez-Rattoni F, Joseph-Bravo P 2005. Analysis of the stress response in rats trained in the water-maze: Differential expression of corticotropin-releasing hormone, CRH-R1, glucocorticoid receptors, and brain-derived neurotrophic factor in limbic regions. Neuroendocrinology 82: 306–319 - PubMed
    1. Allen PA, Grabbe J, McCarthy A, Bush AH, Wallace B 2008. The early bird does not get the worm: Time-of-day effects on college students' basic cognitive processing. Am J Psychol 121: 551–564 - PubMed
    1. Amir S, Cain S, Sullivan J, Robinson B, Stewart J 1999. Olfactory stimulation enhances light-induced phase shifts in free-running activity rhythms and Fos expression in the suprachiasmatic nucleus. Neuroscience 92: 1165–1170 - PubMed
    1. Arnold HM, Burk JA, Hodgson EM, Sarter M, Bruno JP 2002. Differential cortical acetylcholine release in rats performing a sustained attention task versus behavioral control tasks that do not explicitly tax attention. Neuroscience 114: 451–460 - PubMed
    1. Barnes CA, McNaughton BL, Goddard GV, Douglas RM, Adamec R 1977. Circadian rhythm of synaptic excitability in rat and monkey central nervous system. Science 197: 91–92 - PubMed

Publication types

LinkOut - more resources