. 2012 Apr;26(4):562-73.
doi: 10.1210/me.2011-1362. Epub 2012 Mar 1.

Endoplasmic reticulum (ER) stress in cumulus-oocyte complexes impairs pentraxin-3 secretion, mitochondrial membrane potential (DeltaPsi m), and embryo development

Affiliations

Endoplasmic reticulum (ER) stress in cumulus-oocyte complexes impairs pentraxin-3 secretion, mitochondrial membrane potential (DeltaPsi m), and embryo development

Linda L Wu et al. Mol Endocrinol. 2012 Apr.

Abstract

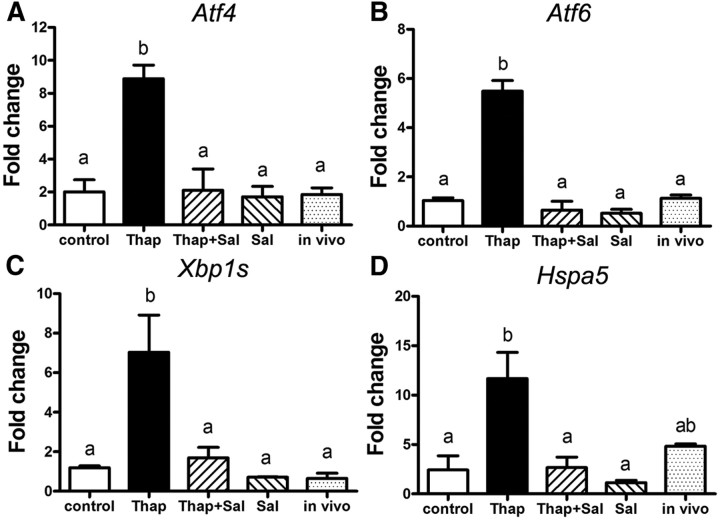
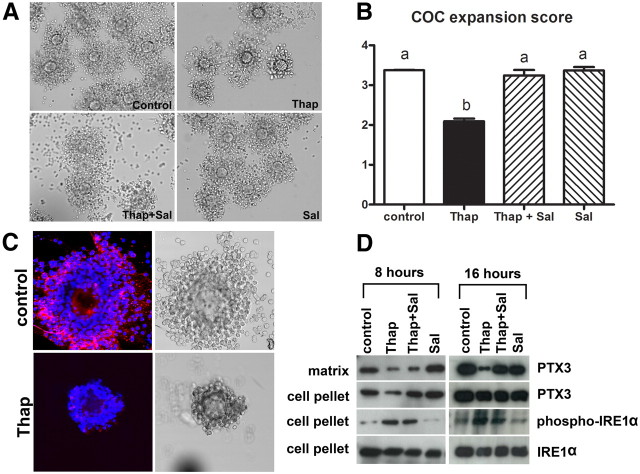
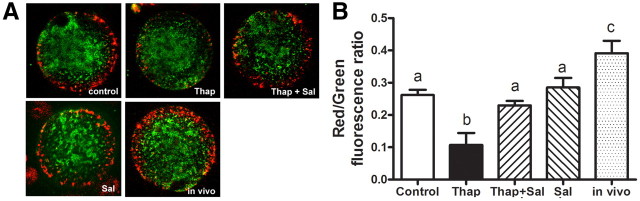
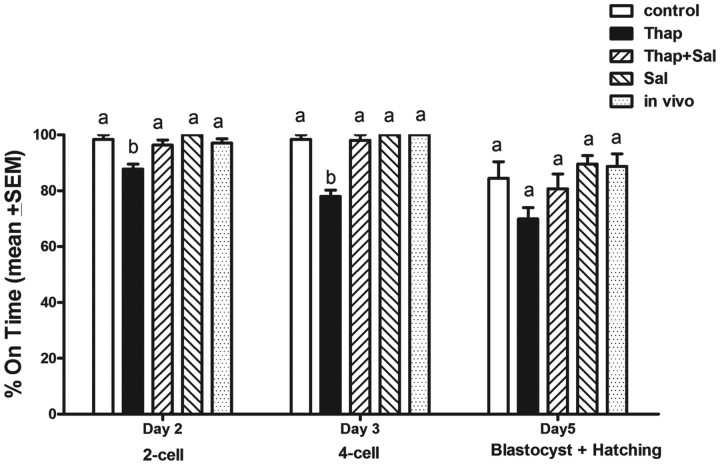
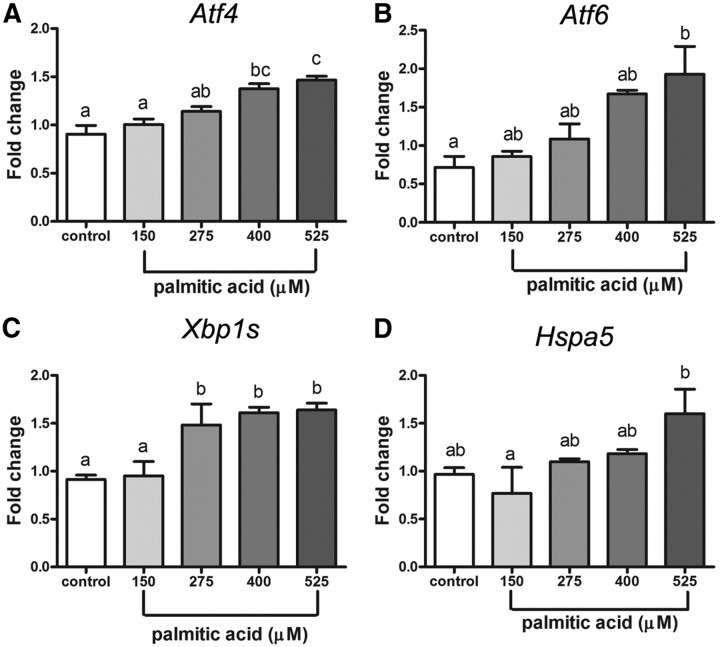
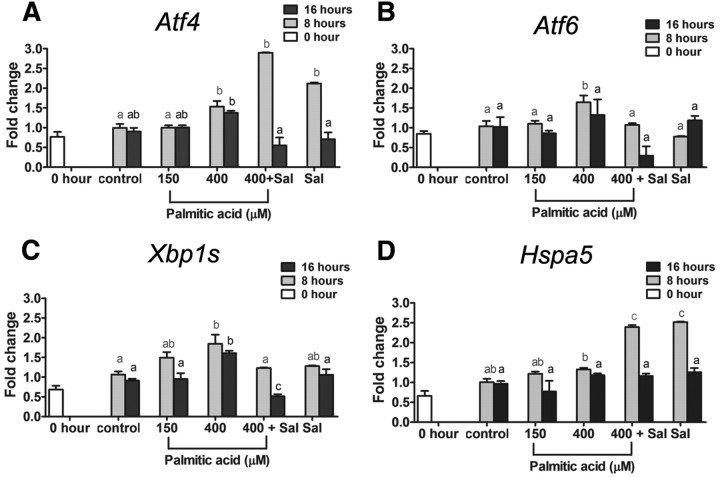
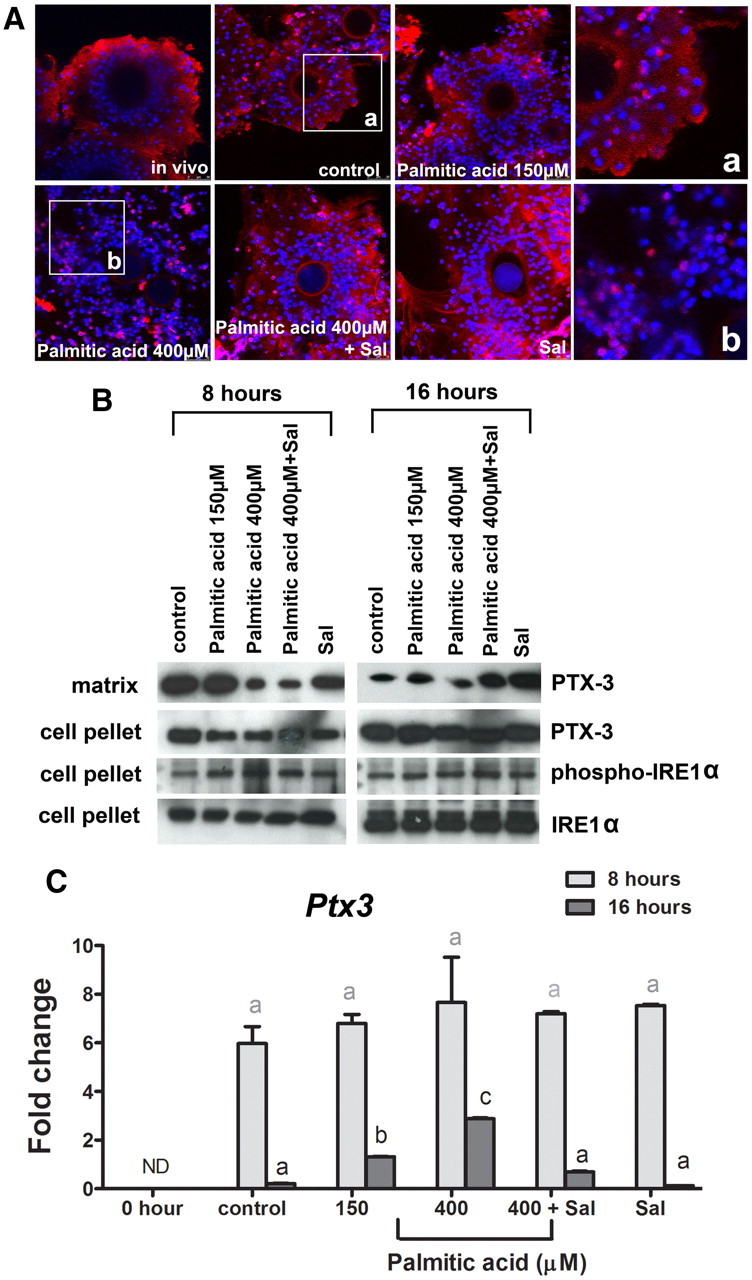
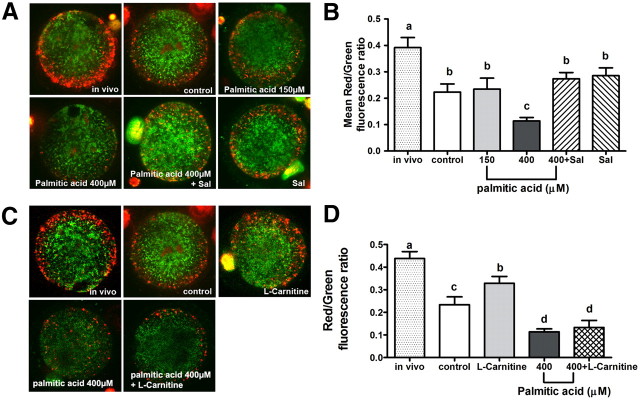
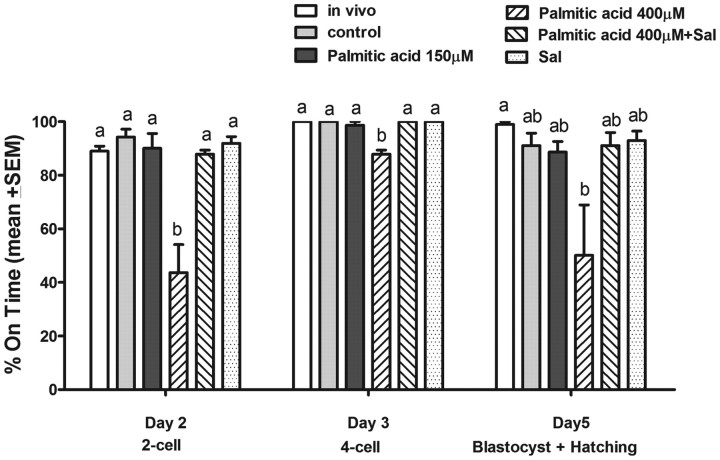
Fatty acids such as palmitic acid at high levels are known to induce endoplasmic reticulum (ER) stress and lipotoxicity in numerous cell types and thereby contribute to cellular dysfunctions in obesity. To understand the impact of high fatty acids on oocytes, ER stress and lipotoxicity were induced in mouse cumulus-oocyte complexes during in vitro maturation using the ER Ca(2+) channel blocker thapsigargin or high physiological levels of palmitic acid; both of which significantly induced ER stress marker genes (Atf4, Atf6, Xbp1s, and Hspa5) and inositol-requiring protein-1α phosphorylation, demonstrating an ER stress response that was reversible with the ER stress inhibitor salubrinal. Assessment of pentraxin-3, an extracellular matrix protein essential for fertilization, by immunocytochemistry and Western blotting showed dramatically impaired secretion concurrent with ER stress. Mitochondrial activity in oocytes was assessed by 5,5',6,6'-tetrachloro-1,1',3,3'-tetraethylbenzimidazolylcarbocyanine iodide staining of inner mitochondrial membrane potential, and oocytes matured in thapsigargin or high-dose palmitic acid had significantly reduced mitochondrial activity, reduced in vitro fertilization rates, and were slower to develop to blastocysts. The deficiencies in protein secretion, mitochondrial activity, and oocyte developmental competence were each normalized by salubrinal, demonstrating that ER stress is a key mechanism mediating fatty acid-induced defects in oocyte developmental potential.


Figures

Fig. 1.
Fig. 1.
Thapsigargin induces ER stress in COC, which can be reversed by salubrinal. Mouse COC were matured in vitro for 16 h in the presence of 100 nm thapsigargin (Thap) or 100 nm thapsigargin plus 100 nm salubrinal (Thap+Sal), or 100 nm salubrinal (Sal) alone or in the absence of thapsigargin and salubrinal as control. Ovulated COC (in vivo matured) from eCG, hCG 16-h-treated mice were used for comparison with in vitro controls. Total RNA was extracted from COC, and expression of ER stress marker genes Atf4 (A), Atf6 (B), Xbp1s (C), and Hspa5 (D) was determined by RT-PCR. Values are mean ± sem expressed as fold change compared with calibrator sample; n = 3 pools of COC per treatment group. Different letters indicate significant differences by one-way ANOVA, Tukey post hoc test, A, P = 0.0016; B, P = 0.0022; C, P < 0.0001; D, P = 0.0184.
Fig. 2.
Fig. 2.
Thapsigargin impairs cumulus expansion and protein secretion, which can be reversed by salubrinal. COC from eCG-treated mice were matured in vitro for 16 h in the presence of 100 nm thapsigargin (Thap), 100 nm thapsigargin plus 100 nm salubrinal (Thap+Sal), 100 nm salubrinal (Sal) alone, or in the absence of thapsigargin and salubrinal as control. A, The morphology of COC matured in vitro. B, COC expansion assessed according to a qualitative scoring system, 0 to +4, and presented as the mean ± sem, n = 3 experimental replicates with more than 25 COC per treatment group. Different letters indicate significant differences by one-way ANOVA, Tukey post hoc test; P < 0.0001. C, Matrix PTX3 (red fluorescence) was reduced in cumulus matrix of thapsigarin (Thap)-treated COC by immunohistochemistry. DAPI nuclear stain is shown as blue fluorescence. D, Western blot analysis of PTX3 from cumulus matrix extracts, and PTX3, phospho-IRE1α, and IRE1α proteins from cell pellets obtained from COC matured for 8 or 16 h.
Fig. 3.
Fig. 3.
ER stress reduces oocyte ΔΨm, which is reversed by salubrinal. A, ΔΨm was assessed by JC-1 staining in oocytes matured in vitro for 16 h in the presence of 100 nm thapsigargin (Thap) or 100 nm thapsigargin plus 100 nm salubrinal (Thap+Sal), or 100 nm salubrinal (Sal) alone, or in the absence of thapsigargin and salubrinal as control. Ovulated COC (in vivo matured) from eCG, hCG 16-h-treated mice were used as a comparison for the in vitro controls. Red fluorescence indicates high ΔΨm, and green indicates low ΔΨm. B, The ratio of red to green fluorescence was quantified as an indicator of mitochondrial activity. Data are presented as mean ± sem, n = 25–35 oocytes from three independent experiments. Different letters indicate significant differences by one-way ANOVA, Tukey post hoc test; P < 0.05.
Fig. 4.
Fig. 4.
COC matured in the presence of thapsigargin have significantly impaired embryo developmental competence after IVF, which is reversible with salubrinal. COC were matured in vitro for 16 h in the presence of 500 nm thapsigargin (Thap) or 500 nm thapsigargin plus 200 nm salubrinal (Thap+Sal), or 200 nm salubrinal (Sal) alone, or in the absence of thapsigargin and salubrinal as control. Ovulated COC (in vivo matured) from eCG, hCG 16-h-treated mice were used as a comparison with the in vitro controls. COC were then fertilized in vitro and the rate of embryo development assessed. Data presented as the mean % on time embryo development ± sem, n = 3 experimental replicates, representative of 90 oocytes per treatment. Day 3 and 5 development is from two-cell embryos on d 2. Different letters indicate significant differences by one-way ANOVA within each developmental stage, Tukey post hoc test; P < 0.05. IVF, in vitro fertilization.
Fig. 5.
Fig. 5.
Palmitic acid dose dependently induces ER stress in COC. COC were matured in vitro for 16 h in 1% FCS as control or plus 150, 275, 400, or 525 μm palmitic acid. Total RNA was extracted from COC, and expression of ER stress marker genes Atf4 (A), Atf6 (B), Xbp1s (C), and Hspa5 (D) was analyzed by RT-PCR. Values are mean ± sem expressed as fold change compared with calibrator sample; n = 3 pools of COC per treatment group. Different letters indicate significant differences by one-way ANOVA, Tukey post hoc test; P < 0.05.
Fig. 6.
Fig. 6.
Induction of ER stress markers by high-dose (400 μm) palmitic acid is reversible by salubrinal. Immature COC from eCG-treated mice (0 h) COC were matured in vitro in 1% FCS as control or plus 150 or 400 μm palmitic acid or 400 μm palmitic acid and 200 nm salubrinal (Sal) for 8 or 16 h. Total RNA was extracted from COC and subjected to RT-PCR for analysis of ER stress marker genes mRNA expression. Atf4 (A), Atf6 (B), Xbp1s (C), and Hspa5 (D) mRNA expression levels were determined. Values are mean ± sem expressed as fold change compared with calibrator sample; n = 3 pools of cells per experiment. Different letters indicate significant differences by one-way ANOVA within each time course, Tukey post hoc test; P < 0.05.
Fig. 7.
Fig. 7.
High-dose (400 μm) palmitic acid reduces PTX3 protein production in COC that is normalized with salubrinal. Immature COC from eCG-treated mice (0 h) COC were matured in vitro in 1% FCS as control or plus 150 or 400 μm palmitic acid or 400 μm palmitic acid and 200 nm salubrinal (Sal) for 8 or 16 h. A, Cumulus matrix PTX3 (red fluorescence) detected by immunocytochemistry was reduced in the cumulus matrix in 400 μm palmitic acid-treated COC. DAPI nuclear stain is shown as blue fluorescence. B, Western blot analysis of extracellular PTX3 from cumulus matrix extracts, and intracellular PTX3, phospho-IRE1α, and IRE1α proteins from cell pellets obtained from COC matured in vitro for 8 or 16 h. C, Ptx3 mRNA expression levels were determined by RT-PCR. Values are mean ± sem expressed as fold change compared with calibrator sample; n = 3 pools of cells per treatment group. Different letters indicate significant differences by one-way ANOVA within each time point, Bonferroni post hoc test; P < 0.05.
Fig. 8.
Fig. 8.
Oocyte ΔΨm is reduced in COC treated with high-dose palmitic acid and reversed by salubrinal but not by L-carnitine. ΔΨm was assessed by JC-1 staining in oocytes matured in vitro in the presence of 150 or 400 μm palmitic acid or without palmitic acid as control. High-dose (400 μm) palmitic acid-treated COC were also treated with either salubrinal (Sal; 200 nm) or L-carnitine (5 mm) as indicated. In vivo-matured oocytes from eCG, hCG 16-h-treated mice were used for comparison with in vitro controls (A and C). The ratio of red to green fluorescence was quantified as an indicator of mitochondrial activity. Data are presented as mean ± sem; n = 30–55 oocytes from three independent experiments. Different letters indicate significant differences by one-way ANOVA, Tukey post hoc test (B and D).
Fig. 9.
Fig. 9.
COC treated with high-dose palmitic acid have significantly impaired embryo development that is reversed by salubrinal. COC from eCG-treated mice were matured in vitro for 16 h in the presence of 150 or 400 μm palmitic acid and/or 200 nm salubrinal (Sal) or without palmitic acid as control. In vivo-matured COC from eCG, hCG 16-h-treated mice were used for comparison with in vitro controls. COC were fertilized in vitro, and oocyte developmental competence was assessed by the rate of embryo development after in vitro fertilization. Data presented as the mean % on time embryo development ± sem, n = 3 independent experiments, representative of 90 oocytes per treatment. Day 3 and 5 development is from two-cell embryos on d 2. Different letters indicate significant differences by one-way ANOVA with Tukey post hoc test at each developmental stage.

Similar articles

Cited by

References

    1. Cusi K. 2010. The role of adipose tissue and lipotoxicity in the pathogenesis of type 2 diabetes. Curr Diab Rep 10:306–315 - PubMed
    1. Waterman CL , Kian-Kai C , Griffin JL. 2010. Metabolomic strategies to study lipotoxicity in cardiovascular disease. Biochim Biophys Acta 1801:230–234 - PubMed
    1. Mei S , Ni HM , Manley S , Bockus A , Kassel KM , Luyendyk JP , Copple BL , Ding WX. 2011. Differential roles of unsaturated and saturated fatty acids on autophagy and apoptosis in hepatocytes. J Pharmacol Exp Ther 339:487–498 - PMC - PubMed
    1. Schaffer JE. 2003. Lipotoxicity: when tissues overeat. Curr Opin Lipidol 14:281–287 - PubMed
    1. Rich-Edwards JW , Spiegelman D , Garland M , Hertzmark E , Hunter DJ , Colditz GA , Willett WC , Wand H , Manson JE. 2002. Physical activity, body mass index, and ovulatory disorder infertility. Epidemiology 13:184–190 - PubMed

MeSH terms