

mRNA-selective translation induced by FSH in primary Sertoli cells
- PMID: 22383463
- PMCID: PMC5417138
- DOI: 10.1210/me.2011-1267
mRNA-selective translation induced by FSH in primary Sertoli cells
Abstract
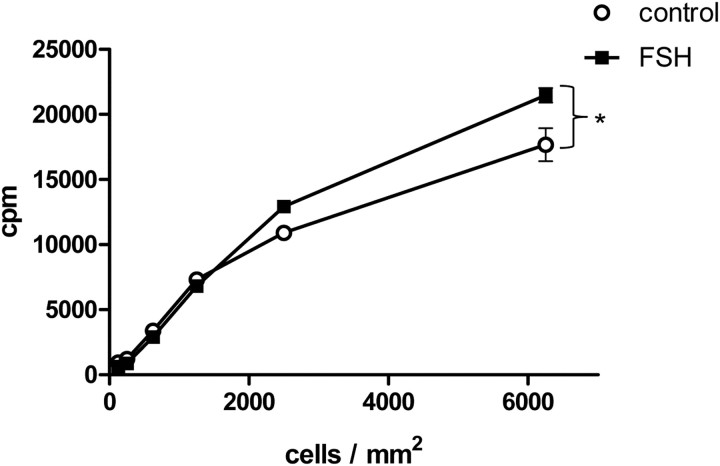
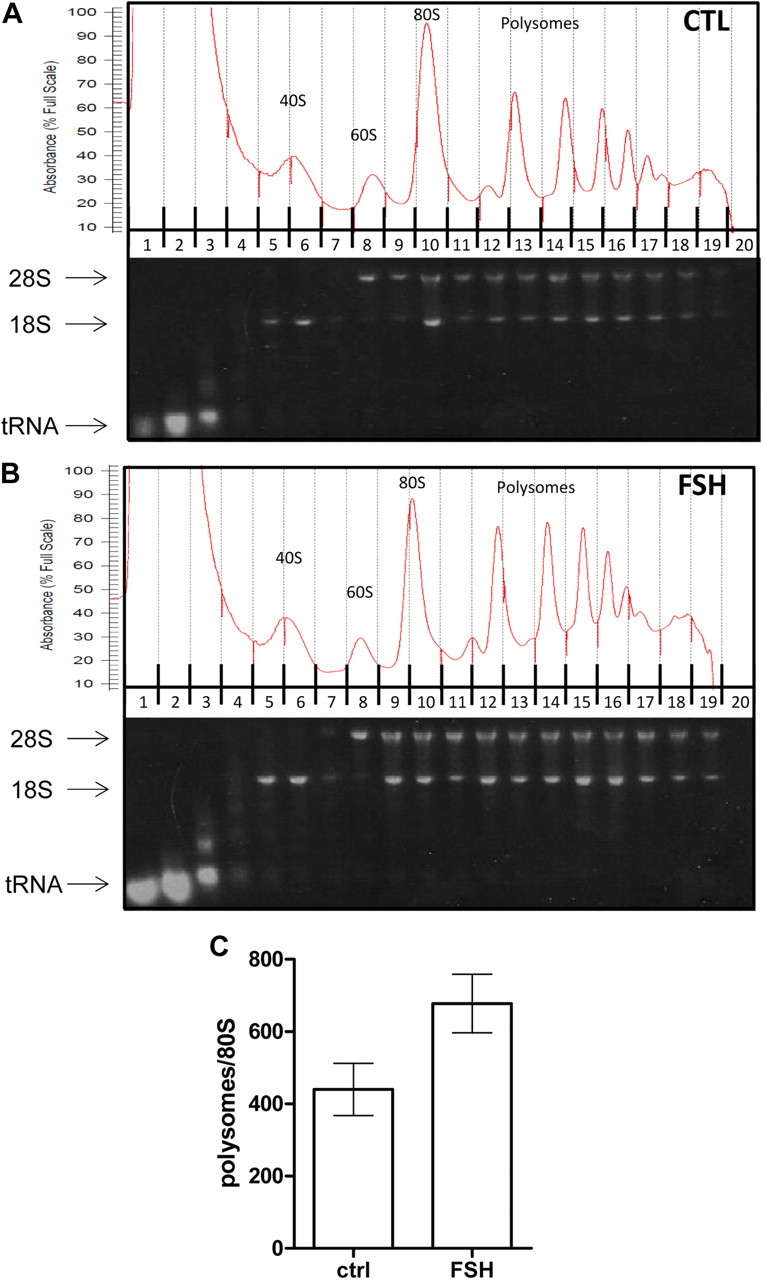
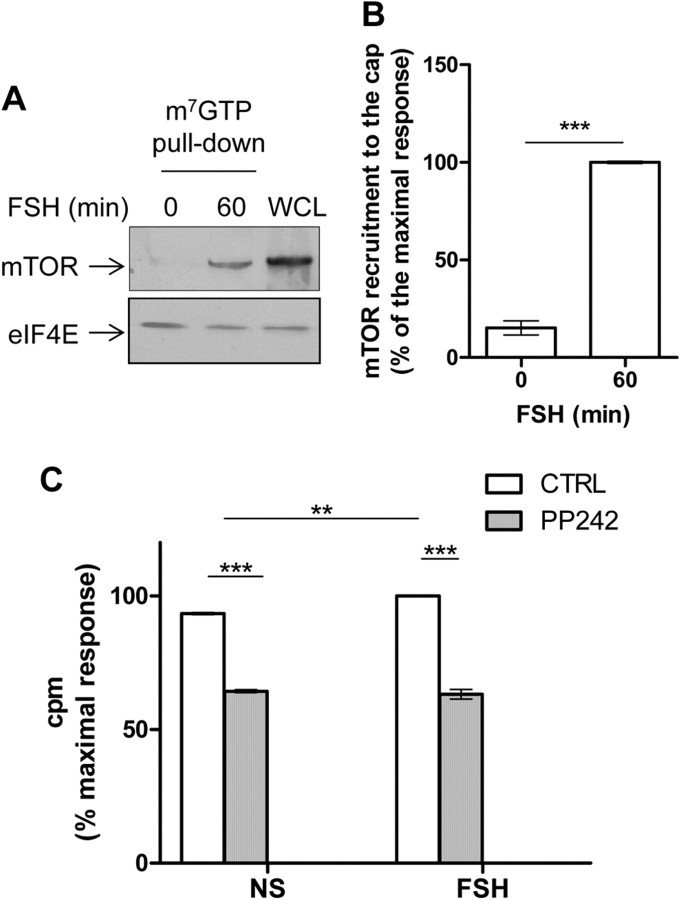
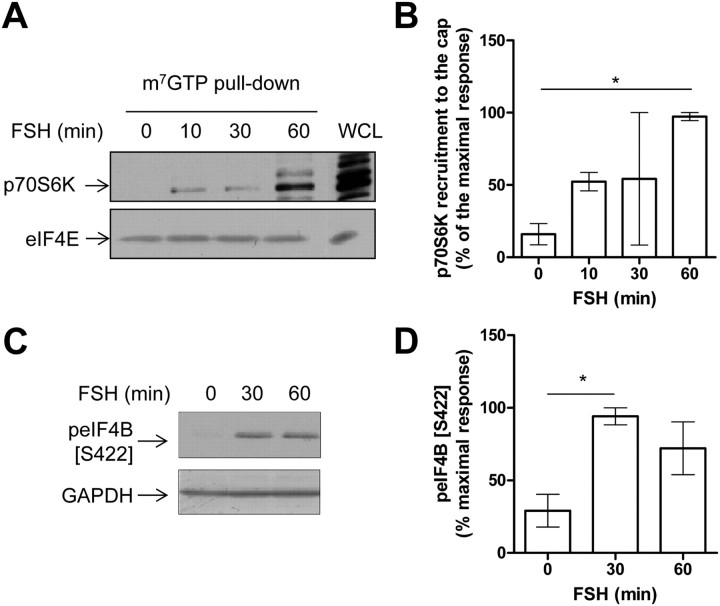
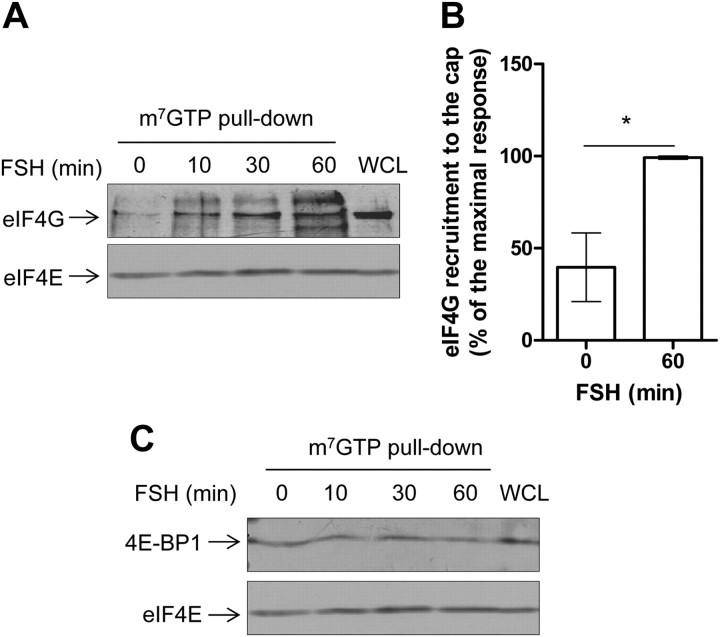
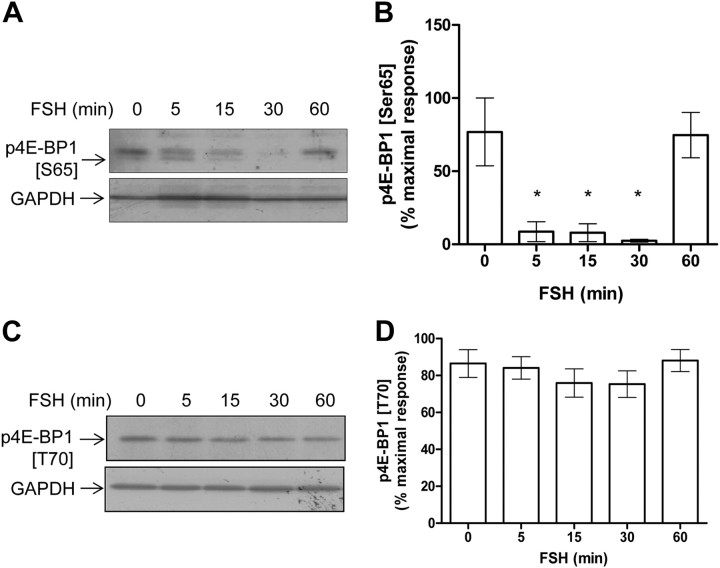
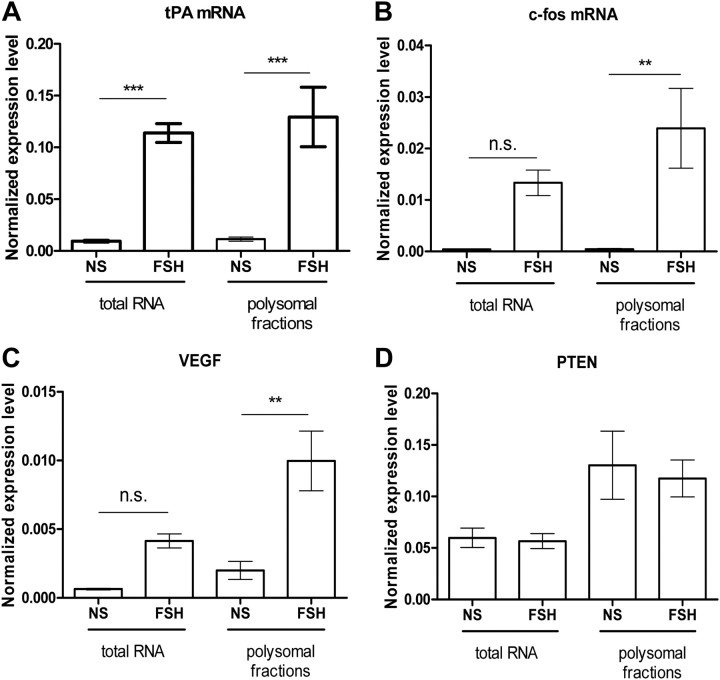
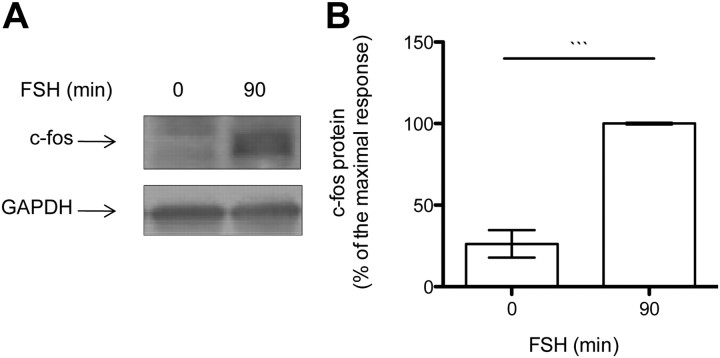
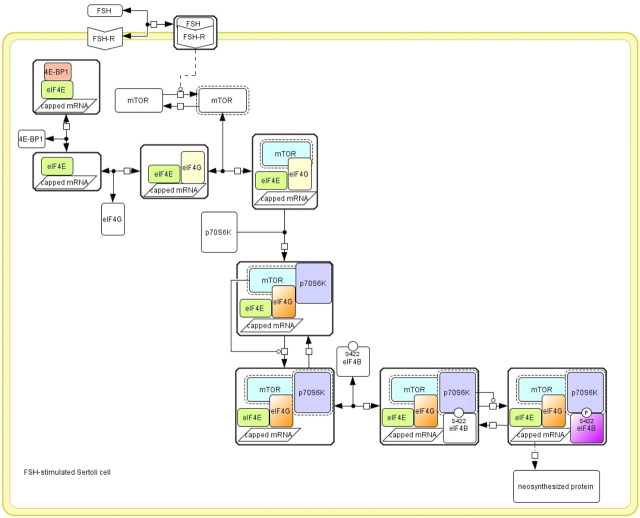
FSH is a key hormonal regulator of Sertoli cell secretory activity, required to optimize sperm production. To fulfil its biological function, FSH binds a G protein-coupled receptor, the FSH-R. The FSH-R-transduced signaling network ultimately leads to the transcription or down-regulation of numerous genes. In addition, recent evidence has suggested that FSH might also regulate protein translation. However, this point has never been demonstrated conclusively yet. Here we have addressed this issue in primary rat Sertoli cells endogenously expressing physiological levels of FSH-R. We observed that, within 90 min of stimulation, FSH not only enhanced overall protein synthesis in a mammalian target of rapamycin-dependent manner but also increased the recruitment of mRNA to polysomes. m(7)GTP pull-down experiments revealed the functional recruitment of mammalian target of rapamycin and p70 S6 kinase to the 5'cap, further supported by the enhanced phosphorylation of one of p70 S6 kinase targets, the eukaryotic initiation factor 4B. Importantly, the scaffolding eukaryotic initiation factor 4G was also recruited, whereas eukaryotic initiation factor 4E-binding protein, the eukaryotic initiation factor 4E generic inhibitor, appeared to play a minor role in translational regulations induced by FSH, in contrast to what is generally observed in response to anabolic factors. This particular regulation of the translational machinery by FSH stimulation might support mRNA-selective translation, as shown here by quantitative RT-PCR amplification of the c-fos and vascular endothelial growth factor mRNA but not of all FSH target mRNA, in polysomal fractions. These findings add a new level of complexity to FSH biological roles in its natural target cells, which has been underappreciated so far.
Figures
Similar articles
-
Activation of a GPCR leads to eIF4G phosphorylation at the 5' cap and to IRES-dependent translation.J Mol Endocrinol. 2014 Jun;52(3):373-82. doi: 10.1530/JME-14-0009. Epub 2014 Apr 7. J Mol Endocrinol. 2014. PMID: 24711644
-
Follicle-stimulating hormone activates p70 ribosomal protein S6 kinase by protein kinase A-mediated dephosphorylation of Thr 421/Ser 424 in primary Sertoli cells.Mol Endocrinol. 2005 Jul;19(7):1812-20. doi: 10.1210/me.2004-0289. Epub 2005 Mar 17. Mol Endocrinol. 2005. PMID: 15774499
-
Global and gene-specific translational regulation in rat lung development.Am J Respir Cell Mol Biol. 2009 May;40(5):555-67. doi: 10.1165/rcmb.2008-0284OC. Epub 2008 Oct 23. Am J Respir Cell Mol Biol. 2009. PMID: 18952566
-
Activation of the p70 S6 kinase and phosphorylation of the 4E-BP1 repressor of mRNA translation by type I interferons.J Biol Chem. 2003 Jul 25;278(30):27772-80. doi: 10.1074/jbc.M301364200. Epub 2003 May 20. J Biol Chem. 2003. PMID: 12759354
-
Amino acids as regulators of gene expression at the level of mRNA translation.J Nutr. 2003 Jun;133(6 Suppl 1):2046S-2051S. doi: 10.1093/jn/133.6.2046S. J Nutr. 2003. PMID: 12771363 Review.
Cited by
-
Gonadotropin and kisspeptin gene expression, but not GnRH, are impaired in cFOS deficient mice.Mol Cell Endocrinol. 2015 Aug 15;411:223-31. doi: 10.1016/j.mce.2015.04.033. Epub 2015 May 6. Mol Cell Endocrinol. 2015. PMID: 25958044 Free PMC article.
-
RiboTag analysis of actively translated mRNAs in Sertoli and Leydig cells in vivo.PLoS One. 2013 Jun 11;8(6):e66179. doi: 10.1371/journal.pone.0066179. Print 2013. PLoS One. 2013. PMID: 23776628 Free PMC article.
-
GnRH Receptor Expression and Reproductive Function Depend on JUN in GnRH Receptor‒Expressing Cells.Endocrinology. 2018 Mar 1;159(3):1496-1510. doi: 10.1210/en.2017-00844. Endocrinology. 2018. PMID: 29409045 Free PMC article.
-
GATA4 variant identified by whole-exome sequencing in a Japanese family with atrial septal defect: Implications for male sex development.Clin Case Rep. 2018 Oct 11;6(11):2229-2233. doi: 10.1002/ccr3.1851. eCollection 2018 Nov. Clin Case Rep. 2018. PMID: 30455927 Free PMC article.
-
FSH for the Treatment of Male Infertility.Int J Mol Sci. 2020 Mar 25;21(7):2270. doi: 10.3390/ijms21072270. Int J Mol Sci. 2020. PMID: 32218314 Free PMC article. Review.
References
-
- Means AR , Hall PF. 1967. Effect of FSH on protein biosynthesis in testes of the immature rat. Endocrinology 81:1151–1160 - PubMed
-
- Sanborn BM , Caston LA , Chang C , Liao S , Speller R , Porter LD , Ku CY. 1991. Regulation of androgen receptor mRNA in rat Sertoli and peritubular cells. Biol Reprod 45:634–641 - PubMed
-
- McLean DJ , Friel PJ , Pouchnik D , Griswold MD. 2002. Oligonucleotide microarray analysis of gene expression in follicle-stimulating hormone-treated rat Sertoli cells. Mol Endocrinol 16:2780–2792 - PubMed
-
- Sadate-Ngatchou PI , Pouchnik DJ , Griswold MD. 2004. Follicle-stimulating hormone induced changes in gene expression of murine testis. Mol Endocrinol 18:2805–2816 - PubMed
Publication types
MeSH terms
Substances
LinkOut - more resources
Full Text Sources
Miscellaneous
