

Raman spectroscopic detection of the T-Hg II-T base pair and the ionic characteristics of mercury
- PMID: 22383582
- PMCID: PMC3384328
- DOI: 10.1093/nar/gks208
Raman spectroscopic detection of the T-Hg II-T base pair and the ionic characteristics of mercury
Abstract
Developing applications for metal-mediated base pairs (metallo-base-pair) has recently become a high-priority area in nucleic acid research, and physicochemical analyses are important for designing and fine-tuning molecular devices using metallo-base-pairs. In this study, we characterized the Hg(II)-mediated T-T (T-Hg(II)-T) base pair by Raman spectroscopy, which revealed the unique physical and chemical properties of Hg(II). A characteristic Raman marker band at 1586 cm(-1) was observed and assigned to the C4=O4 stretching mode. We confirmed the assignment by the isotopic shift ((18)O-labeling at O4) and density functional theory (DFT) calculations. The unusually low wavenumber of the C4=O4 stretching suggested that the bond order of the C4=O4 bond reduced from its canonical value. This reduction of the bond order can be explained if the enolate-like structure (N3=C4-O4(-)) is involved as a resonance contributor in the thymine ring of the T-Hg(II)-T pair. This resonance includes the N-Hg(II)-bonded state (Hg(II)-N3-C4=O4) and the N-Hg(II)-dissociated state (Hg(II+) N3=C4-O4(-)), and the latter contributor reduced the bond order of N-Hg(II). Consequently, the Hg(II) nucleus in the T-Hg(II)-T pair exhibited a cationic character. Natural bond orbital (NBO) analysis supports the interpretations of the Raman experiments.
Figures


 . Bands at 785, 831 and 1092 cm−1 were mainly due to vibration from the phosphate group. The phosphate Raman band at 1092 cm−1 was used as a reference for spectral intensity. Bands at 1487 and 1576 cm−1 are mainly due to guanine, and their negative peaks in spectrum (c) may be ascribed to an increase in the stacking interaction of guanosine residues upon the formation of the T-HgII-T base pair.
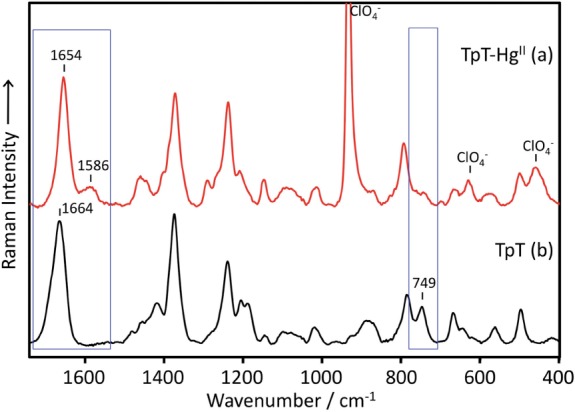
 .
.


Similar articles
-
The structure of metallo-DNA with consecutive thymine-HgII-thymine base pairs explains positive entropy for the metallo base pair formation.Nucleic Acids Res. 2014 Apr;42(6):4094-9. doi: 10.1093/nar/gkt1344. Epub 2013 Dec 26. Nucleic Acids Res. 2014. PMID: 24371287 Free PMC article.
-
Formation of a thymine-Hg(II)-thymine metal-mediated DNA base pair: proposal and theoretical calculation of the reaction pathway.Chemistry. 2013 Jul 22;19(30):9884-94. doi: 10.1002/chem.201300460. Epub 2013 Jun 13. Chemistry. 2013. PMID: 23766024
-
Effects of mercury(II) on structural properties, electronic structure and UV absorption spectra of a duplex containing thymine-mercury(II)-thymine nucleobase pairs.Phys Chem Chem Phys. 2010 Jan 28;12(4):909-17. doi: 10.1039/b912807g. Epub 2009 Dec 7. Phys Chem Chem Phys. 2010. PMID: 20066376
-
Structures, physicochemical properties, and applications of T-Hg(II)-T, C-Ag(I)-C, and other metallo-base-pairs.Chem Commun (Camb). 2015 Dec 21;51(98):17343-60. doi: 10.1039/c5cc02693h. Chem Commun (Camb). 2015. PMID: 26466090 Review.
-
Development of mercury (II) ion biosensors based on mercury-specific oligonucleotide probes.Biosens Bioelectron. 2016 Jan 15;75:433-45. doi: 10.1016/j.bios.2015.09.003. Epub 2015 Sep 2. Biosens Bioelectron. 2016. PMID: 26356764 Review.
Cited by
-
DNA Sensors for the Detection of Mercury Ions.Biosensors (Basel). 2025 Apr 29;15(5):275. doi: 10.3390/bios15050275. Biosensors (Basel). 2025. PMID: 40422014 Free PMC article. Review.
-
The structure of metallo-DNA with consecutive thymine-HgII-thymine base pairs explains positive entropy for the metallo base pair formation.Nucleic Acids Res. 2014 Apr;42(6):4094-9. doi: 10.1093/nar/gkt1344. Epub 2013 Dec 26. Nucleic Acids Res. 2014. PMID: 24371287 Free PMC article.
-
The mechanism of the glycosylase reaction with hOGG1 base-excision repair enzyme: concerted effect of Lys249 and Asp268 during excision of 8-oxoguanine.Nucleic Acids Res. 2017 May 19;45(9):5231-5242. doi: 10.1093/nar/gkx157. Nucleic Acids Res. 2017. PMID: 28334993 Free PMC article.
-
Flexibility and stabilization of HgII-mediated C:T and T:T base pairs in DNA duplex.Nucleic Acids Res. 2017 Mar 17;45(5):2910-2918. doi: 10.1093/nar/gkw1296. Nucleic Acids Res. 2017. PMID: 27998930 Free PMC article.
-
Role of the backbone of nucleic acids in the stability of Hg2+-mediated canonical base pairs and thymine-thymine mispair: a DFT study.RSC Adv. 2020 Nov 10;10(67):40969-40982. doi: 10.1039/d0ra07526d. eCollection 2020 Nov 9. RSC Adv. 2020. PMID: 35519218 Free PMC article.
References
-
- Meggers E, Holland PL, Tolman WB, Romesberg FE, Schultz PG. A novel copper-mediated DNA base pair. J. Am. Chem. Soc. 2000;122:10714–10715.
-
- Atwell S, Meggers E, Spraggon G, Schultz PG. Structure of a copper-mediated base pair in DNA. J. Am. Chem. Soc. 2001;123:12364–12367. - PubMed
-
- Zimmermann N, Meggers E, Schultz PG. A novel silver(I)-mediated DNA base pair. J. Am. Chem. Soc. 2002;124:13684–13685. - PubMed
-
- Zimmermann N, Meggers E, Schultz PG. A second-generation copper(II)-mediated metallo-DNA-base pair. Bioorg. Chem. 2004;32:13–25. - PubMed
-
- Weizman H, Tor Y. 2,2′-bipyridine ligandoside: a novel building block for modifying DNA with intra-duplex metal complexes. J. Am. Chem. Soc. 2001;123:3375–3376. - PubMed
Publication types
MeSH terms
Substances
LinkOut - more resources
Full Text Sources
Other Literature Sources
Medical
Molecular Biology Databases
Miscellaneous
