. 2012 May;23(5):915-33.
doi: 10.1681/ASN.2011101032. Epub 2012 Mar 1.

Identification of gene mutations in autosomal dominant polycystic kidney disease through targeted resequencing

Affiliations

Identification of gene mutations in autosomal dominant polycystic kidney disease through targeted resequencing

Sandro Rossetti et al. J Am Soc Nephrol. 2012 May.

Abstract

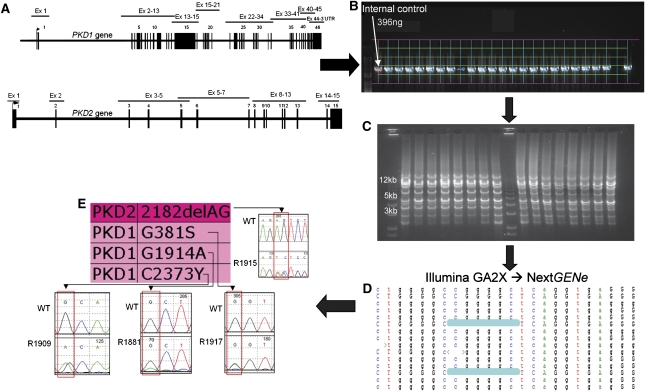
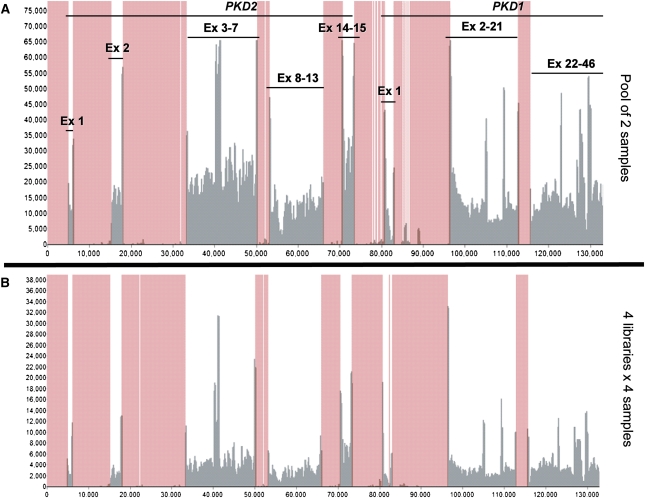
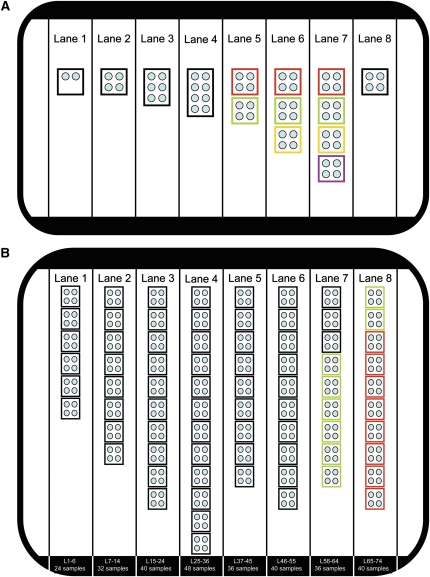
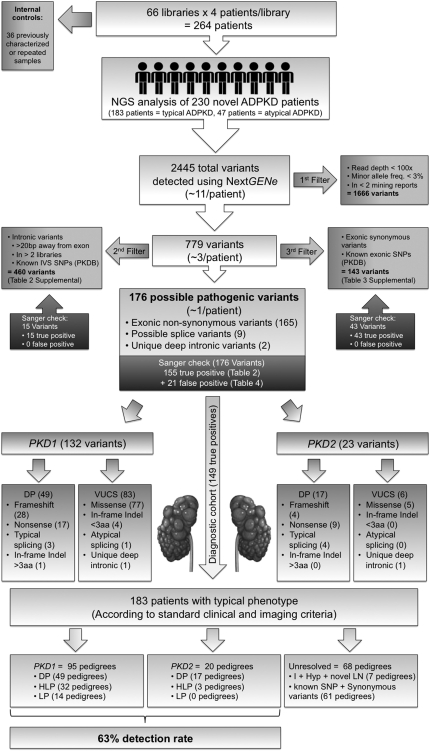
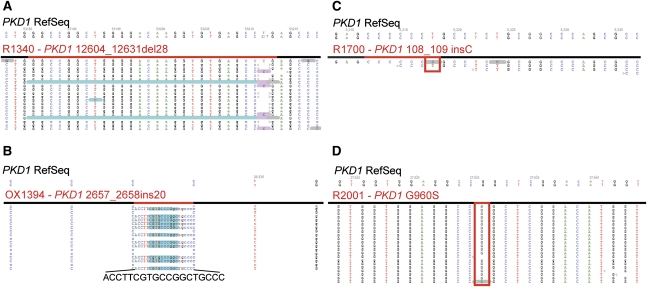
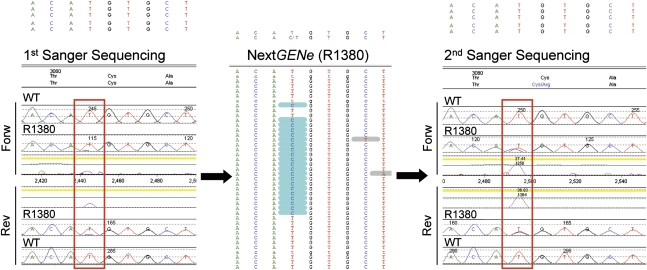
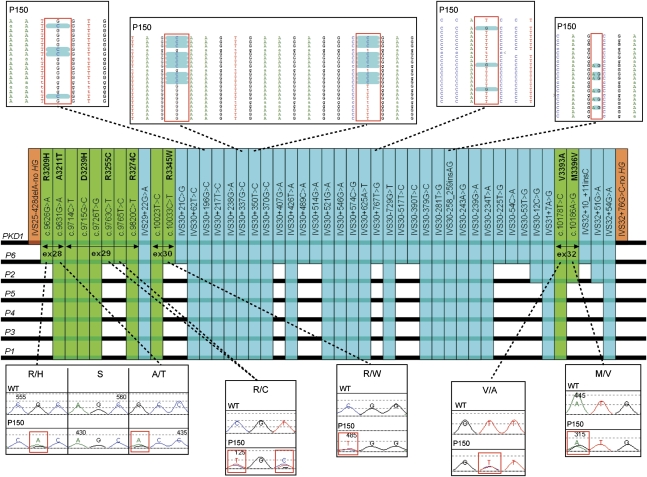
Mutations in two large multi-exon genes, PKD1 and PKD2, cause autosomal dominant polycystic kidney disease (ADPKD). The duplication of PKD1 exons 1-32 as six pseudogenes on chromosome 16, the high level of allelic heterogeneity, and the cost of Sanger sequencing complicate mutation analysis, which can aid diagnostics of ADPKD. We developed and validated a strategy to analyze both the PKD1 and PKD2 genes using next-generation sequencing by pooling long-range PCR amplicons and multiplexing bar-coded libraries. We used this approach to characterize a cohort of 230 patients with ADPKD. This process detected definitely and likely pathogenic variants in 115 (63%) of 183 patients with typical ADPKD. In addition, we identified atypical mutations, a gene conversion, and one missed mutation resulting from allele dropout, and we characterized the pattern of deep intronic variation for both genes. In summary, this strategy involving next-generation sequencing is a model for future genetic characterization of large ADPKD populations.


Figures

Figure 1.
Figure 1.
Schematic visualization of the NGS workflow used in this study. The workflow indicated by the arrows is as follows. (A) Amplicons were individually amplified by long-range PCR. The PKD1 duplicated region (exons 1–33) was amplified as five locus-specific long-range amplicons (2.2–8.7 kb in size), and the same strategy was extended to the PKD1 single-copy region (exons 33–46, three long-range amplicons 2.1–5.9 kb in size) and to the PKD2 gene (six long-range amplicons, 1.2–13 kb in size), covering all coding regions and most intronic regions as a total of 76.2 kb. (B) Amplification was quality verified and normalized by gel densitometry to a sample of known concentration. Two microliters of each amplified product were run on a 0.8% agarose gel for quality check and quantification after fluorescent visualization. Lanes and bands were captured (green lines network), and the actual area of each amplified product intercepted (blue line above each band). Each band was quantified by comparison to a known control (rose line), and values transferred to a spreadsheet for the calculation of the appropriate volume to be used during amplicon assembly. (C) Amplicons were assembled equimolarly for each individual sample, and assembled samples were pooled for each indexed library. Assembled libraries were subsequently quality verified by gel electrophoresis. After assembly, 2 µl of the assembled material was fluorescently visualized on a 0.8% agarose gel to verify the approximate homogeneity of fluorescent intensity and presence of multiple bands corresponding approximately to the expected sizes. (D) Samples were sequenced on an Illumina GA2X instrument, and reads were exported as FASTAQ files, deconvoluted by bar code, and mined using the NextGENe software package. Mutation reports were exported for evaluation. Manual checks of called variants were performed by visualizing the NextGENe alignment as shown. (E) Variants were individually reconfirmed by sequencing the original four samples included in the corresponding library. In the example reported, the four samples included in this library were individually proven to carry the PKD2 change c.2182_2183delAG and three PKD1 amino acid substitutions (p.Gly381Ser, p.Gly1914Ala, and p.Cys2373Tyr, respectively) (indicated in the panel with the short designation 2182delAG, G381S, G1914A, and C2373Y because of space constraints).
Figure 2.
Figure 2.
Read depth and coverage analysis of the proof of principle experiment. The diagram shows that all of the regions of interest (indicated by exon lines) were adequately covered, and compares the read depth obtained when pooling two (A) and multiplexing four libraries of four samples each (B) (lanes 1 and 7 in Figure 3A, respectively). This experiment confirmed that sufficient read depth was obtained when multiplexing (B) four libraries of four samples and suggested that sufficient read depth would be obtained even by multiplexing 12 such libraries per lane. The x-axis represents genomic interval, the y-axis represents number of reads, and the rose-colored areas are out of target regions. Ex, exon.
Figure 3.
Figure 3.
Layout of the two NGS experiments performed in this study. (A) Layout of the proof of principle experiment. The eight lanes of the Illumina flow cell used in the proof of principle experiment are shown: each individual library is shown as a box and each sample as a circle. This proof of principle experiment tested pooling (lanes 1–4) by combining between two and eight samples in the same library, and tested multiplexing (lanes 5–7) by running two to four libraries of four samples each (8, 12, and 16 samples, respectively). Colored boxes indicate the same library during multiplexing (lanes 5–7). Lane 8 tested the discovery workflow by running four unknown samples. All libraries were individually bar coded and paired-end sequenced as 51-bp reads, resulting in an average of 28.5 million paired reads per lane, 91% of which could be re-aligned (approximately 26 million) and generating 10.6 Gb of usable data for variant calling. (B) Layout of the experiment performed to characterize a cohort of 230 novel ADPKD samples. The eight lanes of the Illumina flow cell used in this experiment are shown, and the library and sample number run in each lane is indicated at the bottom. All libraries (boxes) were derived by pooling four samples (small circles). Libraries 1–66 (black and green boxes) were generated by pooling samples after individual PCR amplification, whereas libraries 67–74 (red boxes) were generated by pooling genomic DNA before amplification. Patients in libraries 67–74 (red) and 59–66 (green) are the same. All libraries were individually bar coded and paired end sequenced as 101-bp reads, resulting in an average of 43 million paired reads per lane, 81% of which could be re-aligned (approximately 35 million/lane) and generating 28.3 Gb of re-aligned data suitable for variant calling (much higher than the first experiment due to hardware upgrade of the Illumina instrument). Lane 4 sequenced the highest number of bar codes currently supported by Illumina (12 bar codes, 48 samples).
Figure 4.
Figure 4.
Schematic diagram illustrating the workflow utilized for filtering, parsing, and re-confirming all of the variants derived after the initial data mining in the discovery experiment (Figure 3B). After read re-alignment and variant calling, quality filtering removed 1666 low-confidence variants from the initial pool of 2445 called variants, resulting in 779 high-confidence variants (see Concise Methods for details). This reduced the average number of variants per patient from approximately 10 to 3. Parsing by likelihood of disease association further removed 460 common intronic variants and 143 synonymous or known nonsynonymous exonic polymorphisms, resulting in 176 possible pathogenic variants (approximately 1 per patient). After Sanger re-confirmation, the 155 true positive variants were classified for pathogenicity either as definitely pathogenic (DP) or VUCS, which were further classified as highly likely pathogenic (HLP), likely pathogenic (LP), indeterminate (I), likely hypomorphic (Hyp), and likely neutral (LN) (Table 2 and see Concise Methods). As we focused on the diagnostic cohort of 183 pedigrees (arrow), the genotypes in the pedigrees from this subgroup were classified based on the most pathogenic mutation found as having a DP genotype (49 PKD1 pedigrees and 17 PKD2 pedigrees), an HLP genotype (32 PKD1 pedigrees and 3 PKD2 pedigrees), an LP genotype (14 PKD1 pedigrees) (Table 2). Of the 68 pedigrees with unresolved genotype from the diagnostic cohort of 183 patients, 7 carried I, Hyp, or novel LN genotypes (Table 2). The remaining 61 pedigrees from the diagnostic cohort of 183 patients only had synonymous or known polymorphisms (not shown). Hence, within the diagnostic cohort of 183 typical ADPKD according to standard clinical and imaging criteria, the 115 of 183 resolved pedigrees accounted for a final detection rate of 63%. DP, definitely pathogenic; HLP, highly likely pathogenic; LP, likely pathogenic; I, indeterminate; Hyp, likely hypomorphic; LN, likely neutral.
Figure 5.
Figure 5.
Representative examples of visual inspection of NGS alignments. (A and B) Examples of a medium-sized deletion or insertion. By using the NextGENe elongation approach, indels up to one-third of the total read length were detected (c.12604_12631del28 in A and c.2657_2658ins20 in B). (C and D) Examples of missed mutations because of (C) insufficient read depth or (D) low-scoring variant call. (C) Mutation PKD1 c.108_109insC occurs in a homopolymer of six consecutive C, and it is here covered by a single read that is wild-type for the insertion and shows a below-threshold T>C transition soon after the homopolymer. PKD1 exon 1 is 85% GC rich and seemed to be often under-represented in these experiments, suggesting that the corresponding amplicon should be added in excess to provide sufficient read depth for confident mutation detection. (D) Mutation PKD1 p.Gly960Ser is detected by NextGENe software (gray underlining, one single mutant read in this screenshot) but is assigned a very low-confidence score because of the low number of mutant reads and is consequently removed as low-confidence variant during data mining.
Figure 6.
Figure 6.
Detection of allele dropout in a previous Sanger mutation-negative sample. NGS manual inspection for the previously Sanger-missed mutation PKD1 p.Cys3081Arg (middle panel), showing a high-confidence mutation call at a well covered site; following the NGS workflow, this mutation was correctly identified in sample R1380 (right panel, forward and reverse trace). Comparison with the original Sanger screening (left panel) shows that the mutant cytosine is strongly under-represented in both sequencing directions, suggesting unequal amplification and allele dropout rather than a sequencing artifact as the likely cause.
Figure 7.
Figure 7.
Detailed analysis of a GC event involving PKD1 exons 28–32. By using long amplicons and achieving deep sequencing of all of the IVS regions, detailed genomic data have been obtained of the entire genomic region putatively involved in this GC event. High-score, high-coverage data mining identified 12 exonic (green) and 35 intronic (light blue) variants that match one of the PKD1P1-P6. Careful comparison with available genomic sequence data (PKD1P1-P6) shows a complete match with PKD1P6, suggesting that the GC event took place between PKD1 and the duplicon PKD1P6 over 8.5 kb of genomic sequence. Orange bars are the 5′ and 3′ boundaries of the GC event, before and after which no further PKD1-P1-6 sequence match is observed. Selected Sanger and NGS chromatograms for some of the variants from two family members are shown in the corresponding panels.

References

    1. Dalgaard OZ: Bilateral polycystic disease of the kidneys; a follow-up of two hundred and eighty-four patients and their families. Acta Med Scand Suppl 328: 1–255, 1957 - PubMed
    1. Iglesias CG, Torres VE, Offord KP, Holley KE, Beard CM, Kurland LT: Epidemiology of adult polycystic kidney disease, Olmsted County, Minnesota: 1935-1980. Am J Kidney Dis 2: 630–639, 1983 - PubMed
    1. Rossetti S, Consugar MB, Chapman AB, Torres VE, Guay-Woodford LM, Grantham JJ, Bennett WM, Meyers CM, Walker DL, Bae K, Zhang QJ, Thompson PA, Miller JP, Harris PC, CRISP Consortium : Comprehensive molecular diagnostics in autosomal dominant polycystic kidney disease. J Am Soc Nephrol 18: 2143–2160, 2007 - PubMed
    1. Ravine D, Walker RG, Gibson RN, Forrest SM, Richards RI, Friend K, Sheffield LJ, Kincaid-Smith P, Danks DM: Phenotype and genotype heterogeneity in autosomal dominant polycystic kidney disease. Lancet 340: 1330–1333, 1992 - PubMed
    1. Harris PC, Torres VE: Polycystic kidney disease. Annu Rev Med 60: 321–337, 2009 - PMC - PubMed

Publication types

MeSH terms

Substances