. 2012 Apr 26;119(17):3890-9.
doi: 10.1182/blood-2011-12-379008. Epub 2012 Mar 1.

Acute myeloid leukemia in the real world: why population-based registries are needed

Affiliations

Acute myeloid leukemia in the real world: why population-based registries are needed

Gunnar Juliusson et al. Blood. .

Abstract

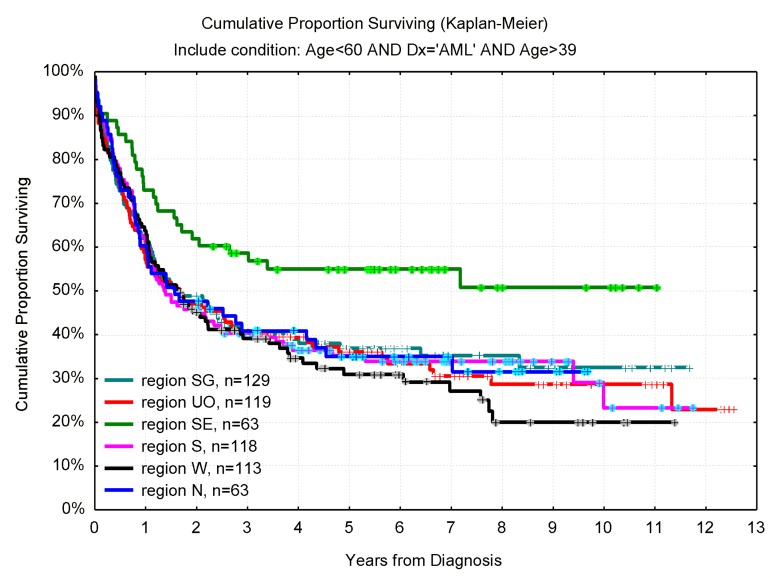
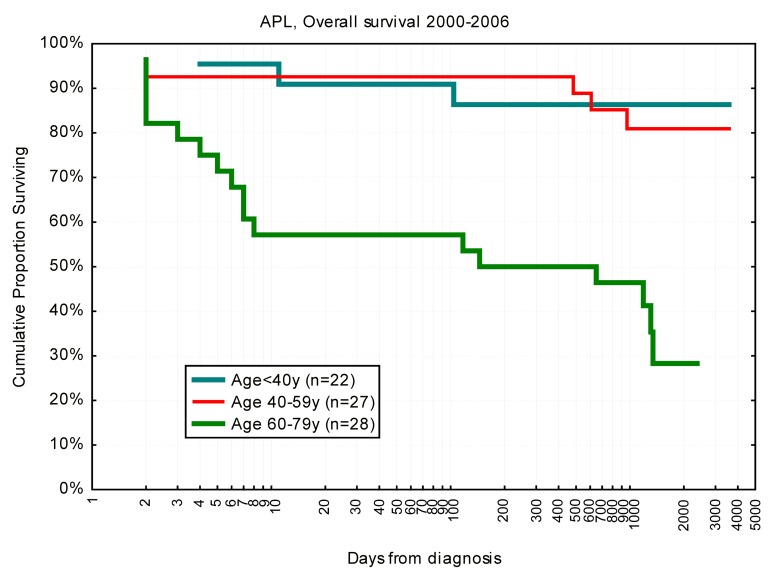
Population-based registries may provide data complementary to that from basic science and clinical intervention studies, all of which are essential for establishing recommendations for the management of patients in the real world. The same quality criteria apply for the evidence-based label, and both high representation and good data quality are crucial in registry studies. Registries with high coverage of the target population reduce the impact of selection on outcome and the subsequent problem with extrapolating data to nonstudied populations. Thus, data useful for clinical decision in situations not well covered by clinical studies can be provided. The potential clinical impact of data from population-based studies is exemplified with analyses from the Swedish Acute Leukemia Registry containing more than 3300 acute myeloid leukemia (AML) patients diagnosed between 1997 and 2006 with a median follow-up of 6.2 years on (1) the role of intensive combination chemotherapy for older patients with AML, (2) the impact of allogeneic stem cell transplantation on survival of younger patients with AML, and (3) the continuing problem with early deaths in acute promyelocytic leukemia. We also present the first Web-based dynamic graph showing the complex interaction between age, performance status, the proportion of patients given intensive treatment, early death rate, complete remission rate, use of allogeneic transplants, and overall survival in AML (non-AML).


Figures

Figure 1
Figure 1
Yearly incidence of AML per 100 000 inhabitants according to age and sex in Sweden 1997 to 2006, in the SEER registry (whites, 2004-2008), and in the United Kingdom. United Kingdom data were given for 20-year age intervals (20-39, 40-59, 60-79, and 80+ years).
Figure 2
Figure 2
Proportion of secondary AML (non-APL, secondary to previous hematologic disease and/or cytotoxic therapy) according to age in the Swedish Registry (1997-2006). Total number of patients is given below graph.
Figure 3
Figure 3
OS according to age for AML (non-APL) patients diagnosed in 1997 to 2006, with follow-up in December 2008., Nine patients were younger than 20 years.
Figure 4
Figure 4
Projected relative 5-year survival in AML according to age and time period, with follow-up on December 31, 2006. Point estimates are from Derolf et al.
Figure 5
Figure 5
OS in days from diagnosis for patients 70 to 79 years of age with AML (non-APL) diagnosed in 1997 to 2006 according to palliative versus intensive intention and WHO/ECOG PS. (A) PS 0-I. (B) PS II. (C) PS III-IV. Note the logarithmic scale on x-axis to emphasize early deaths. Survival < 1 day was set to 1.
Figure 6
Figure 6
Screen shot from Web-based dynamic graph showing 2-year OS (OS2 years) and percentage intensive treatment (TX_rate) according to PS (blue represents PS 0; turquoise, PS I; yellow, PS II; and orange, PS III-IV) for AML non-APL patients 65 to 85 years of age. The full view requires Web connection http://www.ocsyd.se/SwedishAMLRegistry1997_2006/AML_who.html and shows overall 2-year and 3-year survival, early death rate by 8 weeks, proportion receiving intensive treatment, CR rate, and SCT rate by age and PS in patients from the Swedish national acute leukemia registry diagnosed in 1997 to 2006 (AML non-APL; supplemental data, available on the Blood Web site; see the Supplemental Materials link at the top of the online article).
Figure 7
Figure 7
OS in years from diagnosis for AML (non-APL) patients 40 to 59 years of age according to geographic region (Southeast vs others, P = .005). In Southeast region, 46% received allogeneic transplantation compared with 22% (range, 20%-29%) in other regions (P < .01).
Figure 8
Figure 8
OS in days from diagnosis for patients with APL diagnosed 2000 to 2006 according to age. Note logarithmic scale on x-axis to emphasize early deaths. Survival < 1 day was set to 1.

Similar articles

Cited by

References

    1. Codman EA. Boston, MA: private; 1916. A study in hospital efficiency: as demonstrated by the case report of the first five years of a private hospital. - PMC - PubMed
    1. National quality registries in Sweden. 2011. [Accessed November 2011]. http://www.kvalitetsregister.se/om_kvalitetsregister/quality_registries.
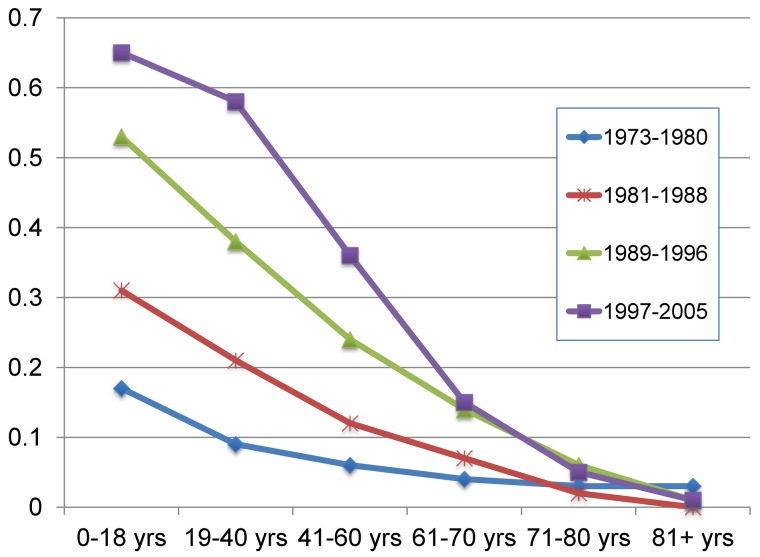
    1. Derolf AR, Kristinsson SY, Andersson TM, Landgren O, Dickman PW, Bjorkholm M. Improved patient survival for acute myeloid leukemia: a population-based study of 9729 patients diagnosed in Sweden between 1973 and 2005. Blood. 2009;113(16):3666–3672. - PubMed
    1. Sackett DL, Rosenberg WM, Gray JA, Haynes RB, Richardson WS. Evidence based medicine: what it is and what it isn't. BMJ. 1996;312(7023):71–72. - PMC - PubMed
    1. Atkins D, Best D, Briss PA, et al. Grading quality of evidence and strength of recommendations. BMJ. 2004;328(7454):1490–1494. - PMC - PubMed

Publication types