. 2012 Apr 19;119(16):3724-33.
doi: 10.1182/blood-2011-09-380634. Epub 2012 Mar 1.

Chromatin occupancy analysis reveals genome-wide GATA factor switching during hematopoiesis

Affiliations

Chromatin occupancy analysis reveals genome-wide GATA factor switching during hematopoiesis

Louis C Doré et al. Blood. .

Abstract

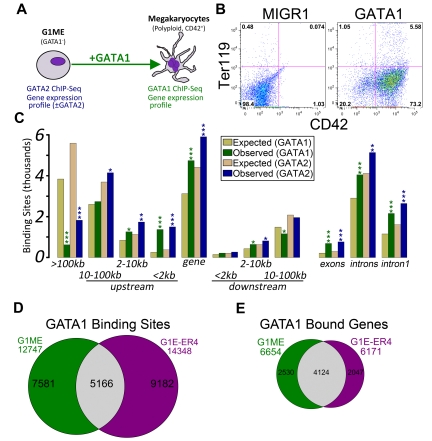
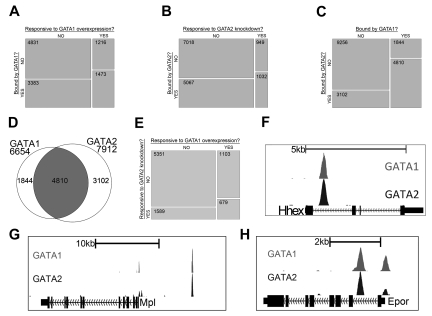
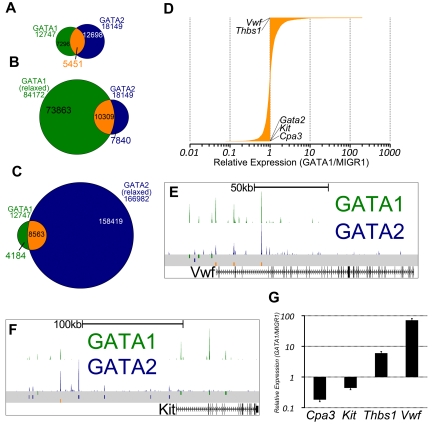
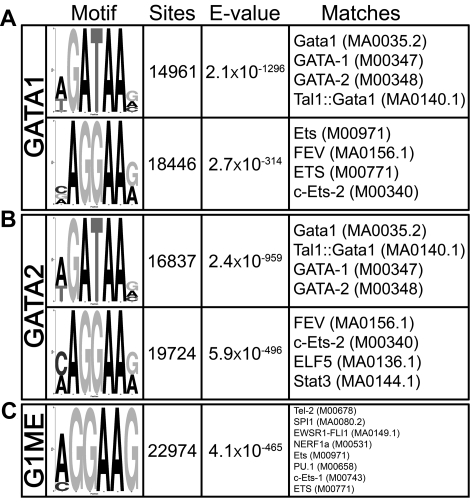
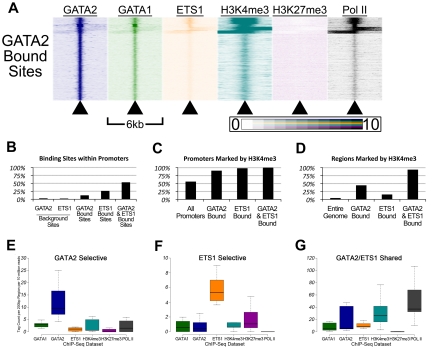
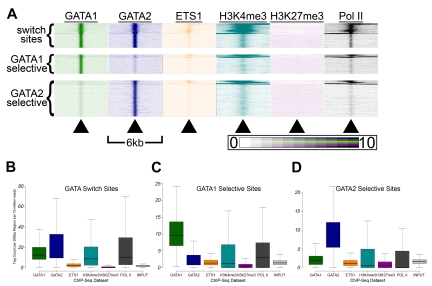
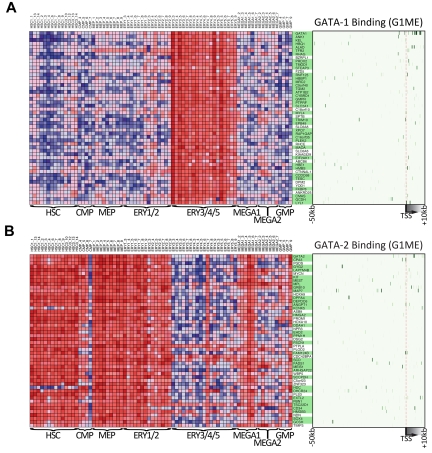
There are many examples of transcription factor families whose members control gene expression profiles of diverse cell types. However, the mechanism by which closely related factors occupy distinct regulatory elements and impart lineage specificity is largely undefined. Here we demonstrate on a genome wide scale that the hematopoietic GATA factors GATA-1 and GATA-2 bind overlapping sets of genes, often at distinct sites, as a means to differentially regulate target gene expression and to regulate the balance between proliferation and differentiation. We also reveal that the GATA switch, which entails a chromatin occupancy exchange between GATA2 and GATA1 in the course of differentiation, operates on more than one-third of GATA1 bound genes. The switch is equally likely to lead to transcriptional activation or repression; and in general, GATA1 and GATA2 act oppositely on switch target genes. In addition, we show that genomic regions co-occupied by GATA2 and the ETS factor ETS1 are strongly enriched for regions marked by H3K4me3 and occupied by Pol II. Finally, by comparing GATA1 occupancy in erythroid cells and megakaryocytes, we find that the presence of ETS factor motifs is a major discriminator of megakaryocyte versus red cell specification.


Figures

Figure 1
Figure 1
Characterization of GATA-1 and GATA-2 binding sites in megakaryocytic cells. (A) Schematic of the model system used in this study, the murine erythromegakaryocytic progenitor cell line, G1ME. Gene expression profiles from GATA-2 knockdown conditions were previously published. (B) Flow cytometric plots showing the erythroid (Ter119) and megakaryocytic (CD42) characteristics of G1ME cells 72 hours after infection with GATA1 virus or GFP alone. (C) Distribution of GATA factor binding sites relative to genes. Gold and tan represent the average results of similar analyses performed on 10 randomly generated background BED files (expected) with identical chromosomal distribution and binding site size as the foreground sets (observed). P values from χ2 tests against the background control were all significant at P < .004. More significant values are as follows: *P < 10−10; **P < 10−50; and ***P < 10−100. (D) Venn diagram showing the intersection of GATA-1 binding sites in GATA-1–restored G1ME cells with the GATA-1 binding sites in estradiol-induced G1E-ER4 cells. A total of 40% of G1ME sites and 36% of G1E sites are bound in the opposite cell type. (E) Venn diagram showing the intersection of GATA-1–bound genes in GATA-1–restored G1ME cells with the GATA-1–bound genes in estradiol-induced G1E-ER4 cells. A total of 62% of G1ME occupied genes and 67% of G1E-ER4 occupied genes are bound in the opposite cell type.
Figure 2
Figure 2
GATA-1 and GATA-2 directly regulate many of the same genes during megakaryocytic development. (A) Mosaic plots showing that GATA-1–bound genes are significantly enriched for genes that are differentially expressed after restoration of GATA-1 in G1ME cells. (B) GATA-2–bound genes are significantly enriched for genes that are differentially expressed after shRNA-mediated down-regulation of GATA-2 in G1ME cells. (C) GATA-2–bound genes are significantly enriched for genes bound by GATA-1. The mosaic plots show the relative numbers of genes in each category as the area of the corresponding rectangle. If the whitespace between rows in each column are perfectly aligned, the response of the genes to the condition on the y-axis is independent of their categorization according to the condition on the x-axis. Deviations from perfect alignment represent enrichment or depletion as a condition of the y-axis category. The total number of genes in each category is shown inside the boxes. (D) Venn diagram showing the intersection of gene lists bound by GATA-1 and GATA-2. A total of 72% of GATA-1–occupied genes and 61% of GATA-2–occupied genes are bound by both factors. (E) Genes differentially expressed after shRNA-mediated down-regulation of GATA-2 are significantly enriched for genes differentially expressed after restoration of GATA-1 in G1ME cells. (F-H) GATA1 (top) and GATA2 (bottom) binding profiles at the Hhex, Mpl, and Epor loci. Peaks represent sequencing tag counts aligning to that genomic position.
Figure 3
Figure 3
The intersection of GATA1 and GATA2 binding site sets reveals GATA1-selective, GATA2-selective, and GATA switch binding sites. (A) Venn diagram showing the intersection of binding sites between the sets of GATA1 and GATA2 binding sites. A total of 43% of GATA1-bound sites and 30% of GATA2-bound sites are GATA “switch sites.” (B-C) Intersection of GATA1 and GATA2 ChIP-Seq binding sites using relaxed binding site identification parameters (P < .01) for one of the factors to allow for identification of a high confidence set of GATA1-selective or GATA2-selective binding sites. (D) Bar graph showing the expression profiles of 3321 GATA switch-bound genes. Data are depicted as relative average expression in GATA1-restored condition compared with the MIGR1 vector control condition. Two of the most strongly induced genes (Vwf and Thbs1) are indicated on the plot. Cpa3, Kit, and Gata2 are strongly repressed by GATA1 restoration and are also indicated on the plot. (E-F) GATA1 and GATA2 binding profiles at the Vwf and Kit loci as in Figure 2F through H. (G) Real-time quantitative PCR to confirm down-regulation of Cpa3 and Kit and the induction of Thbs1 and Vwf following GATA1 restoration in G1ME cells. PCRs were performed in triplicate from biologic duplicates 72 hours after infection. Bars represent the mean relative expression in GATA1-restored condition compared with the MIGR1 vector control condition; error bars represent SD.
Figure 4
Figure 4
GATA-1 and GATA-2 occupied genomic sites are highly enriched for GATA and ETS motifs in megakaryocytes. DREME motif identification of 500-bp sequences surrounding each of the (A) 12 747 GATA1 and (B) 18 149 GATA2 binding sites relative to a shuffled background control. (C) Most enriched motif identified by DREME in megakaryocytic GATA1 binding sites compared with the erythroid GATA1 binding sites as background sequence. The “Motif” column displays the sequence logo generated from the position-weight matrix of the overrepresented motif. The “Sites” column is a count of the number of times a sequence matching the motif appears within the collection of binding site genomic regions. Note that a motif may appear more than one time within a single binding region. “E-value” is a statistical measure of the overrepresentation of the motif; values closer to zero are more statistically significant. The “Matches” column shows the 4 best matches to the motif position-weight matrix from TOMTOM. In parentheses are the unique identifiers for the transcription factor motifs from the Jaspar or Transfac databases.
Figure 5
Figure 5
Genomic sites bound by GATA-2 and ETS-1 are marked by heavy H3K4 trimethylation and occupied by RNA Pol II. (A) Heatmaps depicting the tag density of GATA2 (dark blue), GATA1 (green), ETS1 (orange), H3K4me3 (teal), H3K27me3 (purple), and Pol II (black) across 6-kb genomic regions centered on the locations of each of the 18 149 GATA2 binding sites ordered by k-means clustering. Each row represents a 6-kb genomic region that surrounds a single GATA2 binding site. Columns represent 25-bp bins that are colored according to tag density. Bins were colored on a linear scale where those with zero tags were colored white and bins with 10 or more tags were colored most intensely. (B) Percentage of GATA2-selective, ETS1-selective, and GATA2/ETS1 shared sites that are located within gene proximal promoters, defined as the 2 kb immediately upstream of an annotated TSS. (C) Percentage of promoters bound by GATA2 and/or ETS1 that are also marked by trimethylation on lysine 4 of histone 3. (D) Percentage of non-promoter genomic regions marked by H3K4me3 that are also bound by GATA2 and/or ETS1. (E-G) Box-and-whisker plots show the tag counts for genomic regions bound by GATA2 and/or ETS1, normalized to 200-bp regions and 10 million total reads.
Figure 6
Figure 6
GATA switch sites have higher H3K4me3 and Pol II signals than single-factor bound sites. (A) Tag density heatmaps as in Figure 5A for each of the 5451 GATA switch sites (top), the 4184 GATA1 selective binding sites (middle), and the 7840 GATA2 selective binding sites (bottom). (B-D) Box-and-whisker plots show the tag counts for genomic regions bound by GATA1 and/or GATA2, as in Figure 5E through G.
Figure 7
Figure 7
Genes that are expressed similarly to either GATA1 or GATA2 across human hematopoiesis are often bound by that factor in G1ME cells. (A) The expression levels across primary human hematopoietic cell types for the 50 GATA-1 “nearest neighbor” genes from DMAP are shown in the heatmap on the left. On the right, a heatmap depicts GATA-1 binding at each gene in G1ME cells, where intensity of green represents tag density at that position relative to the model gene depicted below the heatmap. In the center, gene names highlighted in green have binding sites within this potential regulatory region (−50 kb to +10 kb relative to the TSS) or were assigned a binding site by the nearest TSS (within 50 kb) criteria. (B) Heatmaps of GATA-2 “nearest neighbor” genes showing gene expression in primary human hematopoietic (left) and GATA-2 binding sites in G1ME cells (right) as in panel A.

Similar articles

Cited by

References

    1. Doré LC, Crispino JD. Transcription factor networks in erythroid cell and megakaryocyte development. Blood. 2011;118(2):231–239. - PMC - PubMed
    1. Ko LJ, Engel JD. DNA-binding specificities of the GATA transcription factor family. Mol Cell Biol. 1993;13(7):4011–4022. - PMC - PubMed
    1. Merika M, Orkin SH. DNA-binding specificity of GATA family transcription factors. Mol Cell Biol. 1993;13(7):3999–4010. - PMC - PubMed
    1. Tsai FY, Keller G, Kuo FC, et al. An early haematopoietic defect in mice lacking the transcription factor GATA-2. Nature. 1994;371(6494):221–226. - PubMed
    1. Tsai FY, Orkin SH. Transcription factor GATA-2 is required for proliferation/survival of early hematopoietic cells and mast cell formation, but not for erythroid and myeloid terminal differentiation. Blood. 1997;89(10):3636–3643. - PubMed

Publication types

MeSH terms