. 2012 Apr 6;336(6077):91-5.
doi: 10.1126/science.1218004. Epub 2012 Mar 1.

Interleukin-22 drives endogenous thymic regeneration in mice

Affiliations

Interleukin-22 drives endogenous thymic regeneration in mice

Jarrod A Dudakov et al. Science. .

Abstract

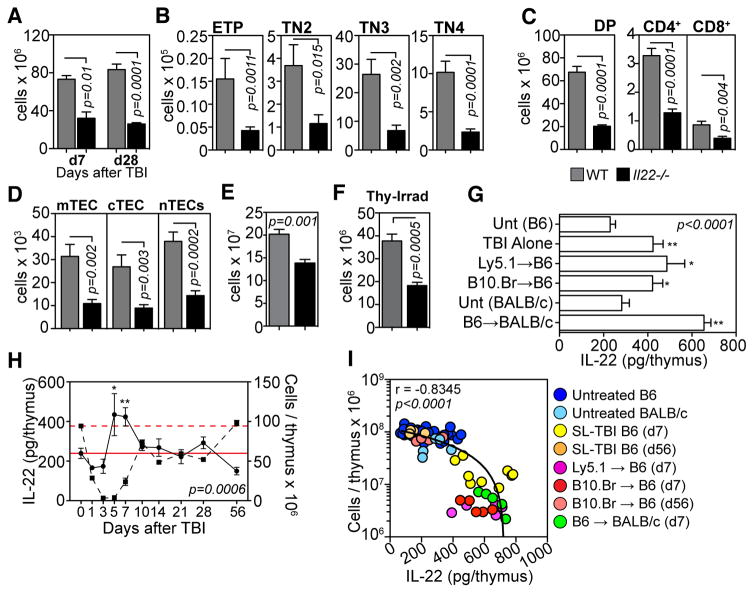
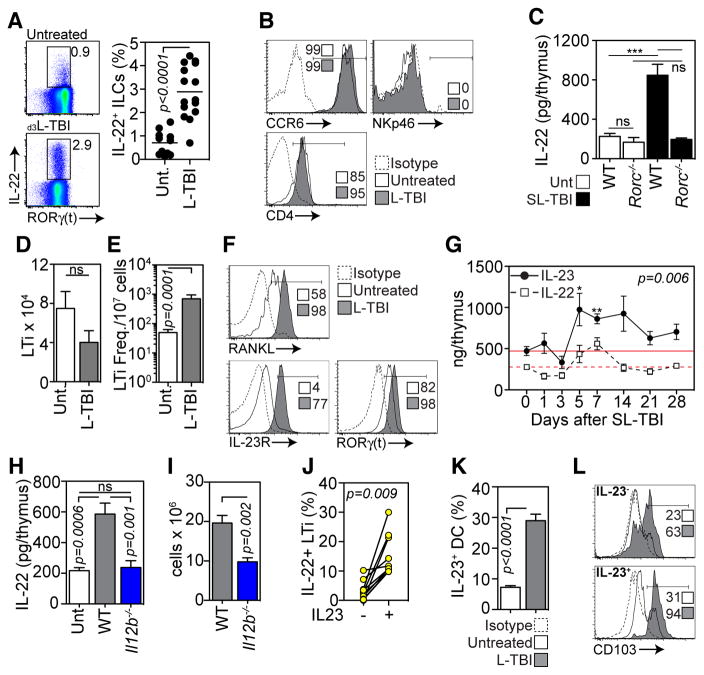
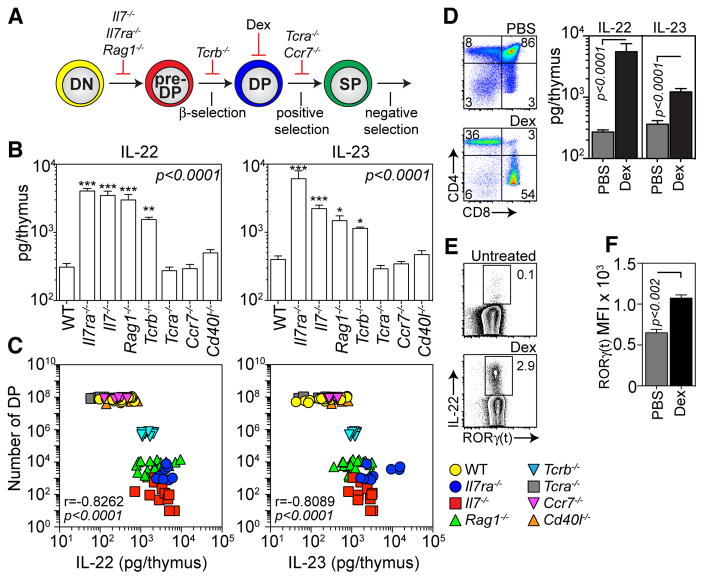
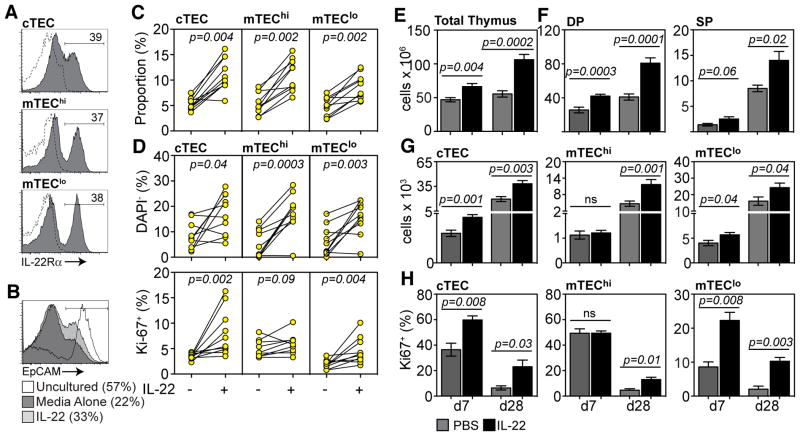
Endogenous thymic regeneration is a crucial function that allows for renewal of immune competence after stress, infection, or immunodepletion. However, the mechanisms governing this regeneration remain poorly understood. We detail such a mechanism, centered on interleukin-22 (IL-22) and triggered by the depletion of CD4(+)CD8(+) double-positive thymocytes. Intrathymic levels of IL-22 were increased after thymic insult, and thymic recovery was impaired in IL-22-deficient mice. IL-22, which signaled through thymic epithelial cells and promoted their proliferation and survival, was up-regulated by radio-resistant RORγ(t)(+)CCR6(+)NKp46(-) lymphoid tissue inducer cells after thymic injury in an IL-23-dependent manner. Administration of IL-22 enhanced thymic recovery after total body irradiation. These studies reveal mechanisms of endogenous thymic repair and offer innovative regenerative strategies for improving immune competence.


Figures

Fig. 1
Fig. 1
IL-22 is critical for endogenous thymic regeneration and is upregulated upon thymic damage. A–D, WT (grey bars, n=11) and Il22−/− (black bars, n=11) C57Bl/6 mice were given SL-TBI (550 cGy) with no hematopoietic rescue and enzyme-digested thymus analyzed. Total thymic cellularity at days 7 and 28 after TBI (A), and developing thymocyte (B–C) and stromal cell subsets (D) 28 days after SL-TBI. E, Total thymus cellularity in WT (n=5) or Il22−/− (n=6) mice 98 days after SL-TBI. F, Total thymus cellularity seven days after targeted thymic-irradiation (850 cGy) of WT (n=10) or Il22−/−(n=7) mice. G, Absolute amounts of intrathymic IL-22 were measured by ELISA in untreated C57BL/6 (n=22), untreated BALB/c (n=5) or 7 days after SL-TBI without HSCT (550 cGy, n=15) or L-TBI and syngeneic HSCT (C57Bl/6 HSCs into congenic C57Bl/6 hosts, 2 × 550 cGy, n=10) or T cell depleted allogeneic-BMT (B10.BR HSCs into MHC-mismatched C57Bl/6 hosts, 2 × 550 cGy, n=10; or C57Bl/6 HSCs into MHC-mismatched BALB/c hosts, 2 × 425 cGy, n=5). H, Absolute amounts of IL-22 (solid circle) plotted with total thymic cellularity (dashed square) over time following SL-TBI (n=5–10/timepoint). Dashed and solid red lines represent mean cellularity and IL-22 amounts respectively at baseline. I, Spearman correlation between absolute amounts of intrathymic IL-22 and total thymic cellularity in various models of thymic insult. Bar graphs represent mean ± SEM of at least 2–3 independent experiments.
Fig. 2
Fig. 2
IL-22 is produced by intrathymic ILCs under the control of IL-23. A–B, Enzyme-digested thymus from untreated (n=11) or three-days after L-TBI (n=15) was incubated with Brefeldin A (3μg/ml) for 4 hours, but otherwise remained unstimulated. A, Intracellular expression of IL-22 and RORγ(t) by CD45+IL-7Rα+CD3CD8 tILCs in untreated or L-TBI animals. B, Expression of CCR6, NKp46 and CD4 on IL-22 producing tILCs. C, IL-22 levels measured by ELISA in thymus of untreated mice or 7 days after SL-TBI in WT or Rorc−/− mice. Absolute number (D) and frequency (E) of CD45+IL-7Rα+CD3CD8CD4+RORγ(t) LTi in untreated mice (n=25) or 3 days after L-TBI (n=10). F, Expression of RANK ligand (RANKL), IL-23R and RORγ(t) in LTi from untreated mice or 3 days after L-TBI. G, C57Bl/6 mice were given SL-TBI (550 cGy) and absolute levels of IL-23 (solid circle) were measured by ELISA at days 1, 3, 5, 7, 10, 14 and 21 (n=5/timepoint). Compared with IL-22 kinetics (dashed square) taken from fig. 1H. H–I, Absolute IL-22 levels measured by ELISA (G) and total thymic cellularity (H) in untreated mice (n=11) or 7 days after SL-TBI in WT (n=10) or Il12b−/− (n=8) animals. J, Untreated WT thymus was enzyme-digested and incubated +/− IL-23 (60ng/ml) for 4 hours. After 1 hour of IL-23 incubation, Brefeldin A was added to all wells. IL-22 expression was examined in CD45+CD3CD8CD4+IL7Rα+RORγ(t)+ LTi. K, Untreated (n=10) or 3 days after L-TBI (n=10) thymus cells were incubated for 4 hours in Monensin (2μM), but otherwise remained unstimulated. Intracellular IL-23 expression in thymic DCs (CD45+CD11c+MHCII+) was measured. L, Expression of CD103 on IL-23-and IL-23+ thymic DCs in untreated and L-TBI mice. Bar graphs represent mean ± SEM of 2–3 independent experiments. FACS plots were generated by concatenation of at least 5 individual observations from one of at least 2 independent experiments.
Fig. 3
Fig. 3
Absence of CD4+CD8+ double positive thymocytes triggers the upregulation of IL-23 and IL-22. A–C, Mutant mouse strains with blocks at different stages of T cell development were assessed for their production of IL-22 and IL-23. A, Schematic of T cell developmental stage blocked in various mutant strains/methods used. B, Absolute IL-22 and IL-23 at baseline in thymus of untreated WT (n=15), Il7Ra−/− (n=9), Il7−/− (n=11), Rag1−/− (n=22), Tcrb−/− (n=10), Tcra−/− (n=18), Ccr7−/− (n=6) and Cd40l−/− (n=10) mice. Statistical comparisons were made with the Kruskal-Wallis test with post-test comparison to WT controls. C, Spearman correlation between number of DP thymocytes and amounts of IL-22 or IL-23 in various mutant mouse strains. D–F, C57Bl/6 mice were treated with PBS (n=10) or Dex (20mg/kg, n=11). D, Thymocyte profiles and absolute amounts of thymus IL-22 and IL-23 were assessed 5 days after treatment. E, Freshly isolated LTi from untreated WT (n=12) or Dex-treated (n=13) mice were analyzed for intracellular IL-22 with no incubation period. F, Mean Fluorescence Intensity (MFI) of RORγ(t) in LTi isolated from untreated or Dex-treated mice. Bar graphs represent mean ± SEM and all data is generated from 2–3 independent experiments. FACS plots were generated by concatenation of at least 5 individual observations from one of at least 2 independent experiments
Fig. 4
Fig. 4
Exogenous administration of recombinant murine IL-22 enhances thymopoiesis by promoting the proliferation and viability of TECs. A, WT thymus was enzyme-digested and enriched for CD45− cells. Expression of IL-22Rα on cTECs (UEA-1lo), mTEClo (UEA-1hiMHCIIlo) and mTEChi (UEA-1hiMHCIIhi). All populations gated on CD45EpCAM+. B–D, CD45 or MHC-II+ enriched thymus cells were incubated for 24 hours +/− IL-22 (100ng/ml). B, Expression of EpCAM in uncultured CD45− cells (n=5) and in CD45− cells incubated for 24 hours with IL-22 (n=10) or media alone (n=10). C, Proportion of specific TEC subsets in CD45 cells incubated for 24 hours +/− IL-22. D, Expression of DAPI and Ki-67 on TEC subsets on MHCII-enriched thymus cells after 24 hours of incubation with IL-22 (n=10) or media alone (n=10). For in vitro experiments with enriched cells, each individual observation represents 3–4 pooled thymuses. E–H, C57Bl/6 mice were given SL-TBI (550 cGy), treated with PBS (grey bars, n=10) or IL-22 (black bars, 200μg/kg/day, n=10–15) at days −1, 0 and +1 and assessed at days 7 and 28. Total thymus cellularity (E) and absolute number of thymocyte (F) and TEC subsets (G). H, Proportion of Ki-67 expressing cTECs, mTEClo and mTEChi. Bar graphs represent mean ± SEM of at least 2 independent experiments. FACS plots were generated by concatenation of at least 5 individual observations from one of at least 2 independent experiments.

Comment in

Similar articles

Cited by

References

    1. Gruver AL, Sempowski GD. Cytokines, leptin, and stress-induced thymic atrophy. J Leuk Biol. 2008 Oct;84:915. - PMC - PubMed
    1. van den Brink MR, Alpdogan O, Boyd RL. Strategies to enhance T-cell reconstitution in immunocompromised patients. Nat Rev Immunol. 2004 Nov;4:856. - PubMed
    1. Storek J, Witherspoon RP, Storb R. T cell reconstitution after bone marrow transplantation into adult patients does not resemble T cell development in early life. Bone Marrow Transplant. 1995 Sep;16:413. - PubMed
    1. Takahama Y. Journey through the thymus: stromal guides for T-cell development and selection. Nat Rev Immunol. 2006 Feb;6:127. - PubMed
    1. Petrie HT, Zuniga-Pflucker JC. Zoned out: functional mapping of stromal signaling microenvironments in the thymus. Annu Rev Immunol. 2007;25:649. - PubMed

Publication types

MeSH terms