Review
. 2012;8(2):e1002375.
doi: 10.1371/journal.pcbi.1002375. Epub 2012 Feb 23.

Ten years of pathway analysis: current approaches and outstanding challenges

Affiliations
Review

Ten years of pathway analysis: current approaches and outstanding challenges

Purvesh Khatri et al. PLoS Comput Biol. 2012.

Abstract

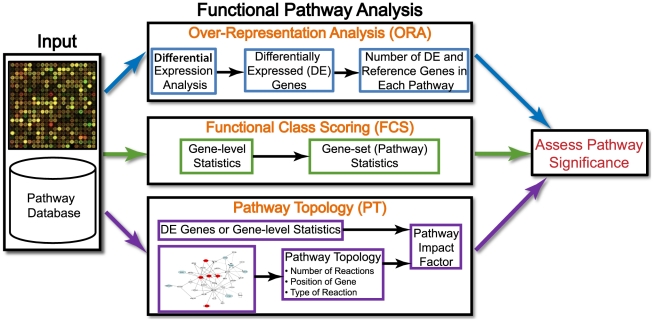
Pathway analysis has become the first choice for gaining insight into the underlying biology of differentially expressed genes and proteins, as it reduces complexity and has increased explanatory power. We discuss the evolution of knowledge base-driven pathway analysis over its first decade, distinctly divided into three generations. We also discuss the limitations that are specific to each generation, and how they are addressed by successive generations of methods. We identify a number of annotation challenges that must be addressed to enable development of the next generation of pathway analysis methods. Furthermore, we identify a number of methodological challenges that the next generation of methods must tackle to take advantage of the technological advances in genomics and proteomics in order to improve specificity, sensitivity, and relevance of pathway analysis.


Conflict of interest statement

The authors have declared that no competing interests exist.

Figures

Figure 1
Figure 1. Overview of existing pathway analysis methods using gene expression data as an example.
Note that this overview is equally applicable to molecular measurements using proteomics, and any other high-throughput technologies. The data generated by an experiment using a high-throughput technology (e.g., microarray, proteomics, metabolomics), along with functional annotations (pathway database) of the corresponding genome, are input to virtually all pathway analysis methods. While ORA methods require that the input is a list of differentially expressed genes, FCS methods use the entire data matrix as input. In addition to functional annotations of a genome, PT-based methods utilize the number and type of interactions between gene products, which may or may not be a part of a pathway database. The result of every pathway analysis method is a list of significant pathways in the condition under study. DE, differentially expressed.
Figure 2
Figure 2. Overview of low resolution, missing, and incomplete information.
Green arrows represent abundantly available information, and red arrows represent missing and/or incomplete information. The ultimate goal of pathway analysis is to analyze a biological system as a large, single network. However, the links between smaller individual pathways are not yet well known. Furthermore, the effects of a SNP on a given pathway are also missing from current knowledge bases. While some pathways are known to be related to a few diseases, it is not clear whether the changes in pathways are the cause for those diseases or the downstream effects of the diseases.
Figure 3
Figure 3. Number of GO-annotated genes (left panel) and number of GO annotations (right panel) for human from January 2003 to November 2009.
As the estimated number of known genes in the human genome is adjusted (between January 2003 and December 2003) and annotation practices are modified (between December 2004 and December 2005, and between October 2008 and November 2009), one can argue that, although the number of annotated genes and the annotations are decreasing (which is mainly due to the adjusted number of genes in the human genome and changes in the annotation process), the quality of annotations is improving, as demonstrated by the steady increase in non-IEA annotations and the number of genes with non-IEA annotations. However, the increase in the number of genes with non-IEA annotations is very slow. In almost 7 years, between January 2003 and November 2009, only 2,039 new genes received non-IEA annotations. At the same time, the number of non-IEA annotations increased from 35,925 to 65,741, indicating a strong research bias for a small number of genes.

References

    1. Glazko G, Emmert-Streib F. Unite and conquer: univariate and multivariate approaches for finding differentially expressed gene sets. Bioinformatics. 2009;25:2348–2354. - PMC - PubMed
    1. Green ML, Karp PD. The outcomes of pathway database computations depend on pathway ontology. Nucleic Acids Res. 2006;34:3687–3697. - PMC - PubMed
    1. Goeman JJ, Buhlmann P. Analyzing gene expression data in terms of gene sets: methodological issues. Bioinformatics. 2007;23:980–987. - PubMed
    1. Khatri P, Drăghici S, Ostermeier GC, Krawetz SA. Profiling gene expression using Onto-Express. Genomics. 2002;79:266–270. - PubMed
    1. Drăghici S, Khatri P, Martins RP, Ostermeier GC, Krawetz SA. Global functional profiling of gene expression. Genomics. 2003;81:98–104. - PubMed

Publication types