

A cell-based computational modeling approach for developing site-directed molecular probes
- PMID: 22383866
- PMCID: PMC3285574
- DOI: 10.1371/journal.pcbi.1002378
A cell-based computational modeling approach for developing site-directed molecular probes
Abstract
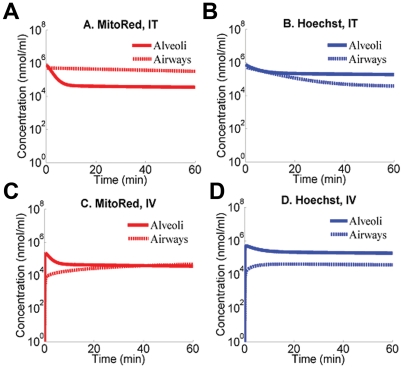
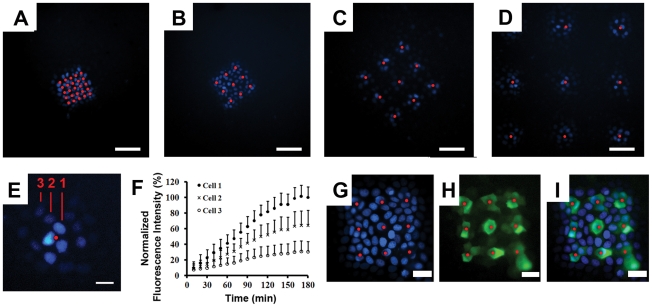
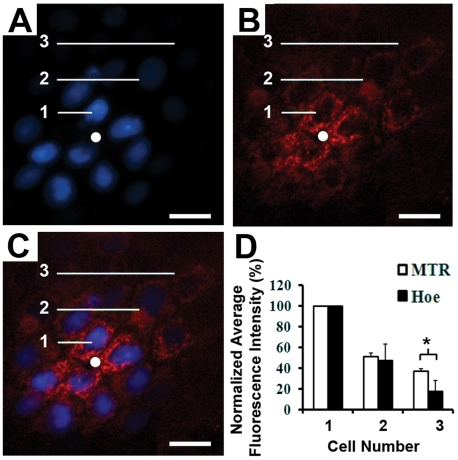
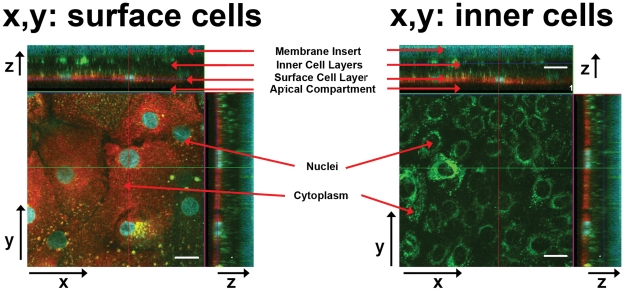
Modeling the local absorption and retention patterns of membrane-permeant small molecules in a cellular context could facilitate development of site-directed chemical agents for bioimaging or therapeutic applications. Here, we present an integrative approach to this problem, combining in silico computational models, in vitro cell based assays and in vivo biodistribution studies. To target small molecule probes to the epithelial cells of the upper airways, a multiscale computational model of the lung was first used as a screening tool, in silico. Following virtual screening, cell monolayers differentiated on microfabricated pore arrays and multilayer cultures of primary human bronchial epithelial cells differentiated in an air-liquid interface were used to test the local absorption and intracellular retention patterns of selected probes, in vitro. Lastly, experiments involving visualization of bioimaging probe distribution in the lungs after local and systemic administration were used to test the relevance of computational models and cell-based assays, in vivo. The results of in vivo experiments were consistent with the results of in silico simulations, indicating that mitochondrial accumulation of membrane permeant, hydrophilic cations can be used to maximize local exposure and retention, specifically in the upper airways after intratracheal administration.
Conflict of interest statement
The authors have declared that no competing interests exist.
Figures


Similar articles
-
Permeability characteristics of calu-3 human bronchial epithelial cells: in vitro-in vivo correlation to predict lung absorption in rats.J Drug Target. 2002 Feb;10(1):31-40. doi: 10.1080/10611860290007504. J Drug Target. 2002. PMID: 11996084
-
Cell-based multiscale computational modeling of small molecule absorption and retention in the lungs.Pharm Res. 2010 Mar;27(3):457-67. doi: 10.1007/s11095-009-0034-9. Epub 2010 Jan 23. Pharm Res. 2010. PMID: 20099073 Free PMC article.
-
Development of fluorescent probes for bioimaging applications.Proc Jpn Acad Ser B Phys Biol Sci. 2010;86(8):837-47. doi: 10.2183/pjab.86.837. Proc Jpn Acad Ser B Phys Biol Sci. 2010. PMID: 20948177 Free PMC article. Review.
-
Translocation of gold nanoparticles across the lung epithelial tissue barrier: Combining in vitro and in silico methods to substitute in vivo experiments.Part Fibre Toxicol. 2015 Jun 27;12:18. doi: 10.1186/s12989-015-0090-8. Part Fibre Toxicol. 2015. PMID: 26116549 Free PMC article.
-
In vitro, ex vivo and in vivo methods of lung absorption for inhaled drugs.Adv Drug Deliv Rev. 2020;161-162:63-74. doi: 10.1016/j.addr.2020.07.025. Epub 2020 Aug 4. Adv Drug Deliv Rev. 2020. PMID: 32763274 Review.
Cited by
-
Computational approaches to analyse and predict small molecule transport and distribution at cellular and subcellular levels.Biopharm Drug Dispos. 2014 Jan;35(1):15-32. doi: 10.1002/bdd.1879. Epub 2013 Dec 10. Biopharm Drug Dispos. 2014. PMID: 24218242 Free PMC article. Review.
-
Visualizing chemical structure-subcellular localization relationships using fluorescent small molecules as probes of cellular transport.J Cheminform. 2013 Oct 5;5(1):44. doi: 10.1186/1758-2946-5-44. J Cheminform. 2013. PMID: 24093553 Free PMC article.
-
Functional and cytometric examination of different human lung epithelial cell types as drug transport barriers.Arch Pharm Res. 2016 Mar;39(3):359-69. doi: 10.1007/s12272-015-0704-6. Epub 2016 Jan 8. Arch Pharm Res. 2016. PMID: 26746641 Free PMC article.
-
Spatio-temporal simulation of first pass drug perfusion in the liver.PLoS Comput Biol. 2014 Mar 13;10(3):e1003499. doi: 10.1371/journal.pcbi.1003499. eCollection 2014 Mar. PLoS Comput Biol. 2014. PMID: 24625393 Free PMC article.
-
The extracellular microenvironment explains variations in passive drug transport across different airway epithelial cell types.Pharm Res. 2013 Aug;30(8):2118-32. doi: 10.1007/s11095-013-1069-5. Epub 2013 May 25. Pharm Res. 2013. PMID: 23708857 Free PMC article.
References
-
- King M. Experimental models for studying mucociliary clearance. Eur Respir J. 1998;11:222–228. - PubMed
-
- Sturm R, Hofmann W, Scheuch G, Sommerer K, Camner P, et al. Particle Clearance in Human Bronchial Airways: Comparison of Stochastic Model Predictions with Experimental Data. Ann Occup Hyg. 2002;46:329–333. - PubMed
-
- Tronde A, Norden B, Jeppsson AB, Brunmark P, Nilsson E, et al. Drug absorption from the isolated perfused rat lung–correlations with drug physicochemical properties and epithelial permeability. J Drug Target. 2003;11:61–74. - PubMed
-
- Trapp S, Horobin RW. A predictive model for the selective accumulation of chemicals in tumor cells. Eur Biophys J. 2005;34:959–966. - PubMed
Publication types
MeSH terms
Substances
Grants and funding
LinkOut - more resources
Full Text Sources
