

Robust detection of hierarchical communities from Escherichia coli gene expression data
- PMID: 22383870
- PMCID: PMC3285575
- DOI: 10.1371/journal.pcbi.1002391
Robust detection of hierarchical communities from Escherichia coli gene expression data
Abstract
Determining the functional structure of biological networks is a central goal of systems biology. One approach is to analyze gene expression data to infer a network of gene interactions on the basis of their correlated responses to environmental and genetic perturbations. The inferred network can then be analyzed to identify functional communities. However, commonly used algorithms can yield unreliable results due to experimental noise, algorithmic stochasticity, and the influence of arbitrarily chosen parameter values. Furthermore, the results obtained typically provide only a simplistic view of the network partitioned into disjoint communities and provide no information of the relationship between communities. Here, we present methods to robustly detect co-regulated and functionally enriched gene communities and demonstrate their application and validity for Escherichia coli gene expression data. Applying a recently developed community detection algorithm to the network of interactions identified with the context likelihood of relatedness (CLR) method, we show that a hierarchy of network communities can be identified. These communities significantly enrich for gene ontology (GO) terms, consistent with them representing biologically meaningful groups. Further, analysis of the most significantly enriched communities identified several candidate new regulatory interactions. The robustness of our methods is demonstrated by showing that a core set of functional communities is reliably found when artificial noise, modeling experimental noise, is added to the data. We find that noise mainly acts conservatively, increasing the relatedness required for a network link to be reliably assigned and decreasing the size of the core communities, rather than causing association of genes into new communities.
Conflict of interest statement
The authors have declared that no competing interests exist.
Figures
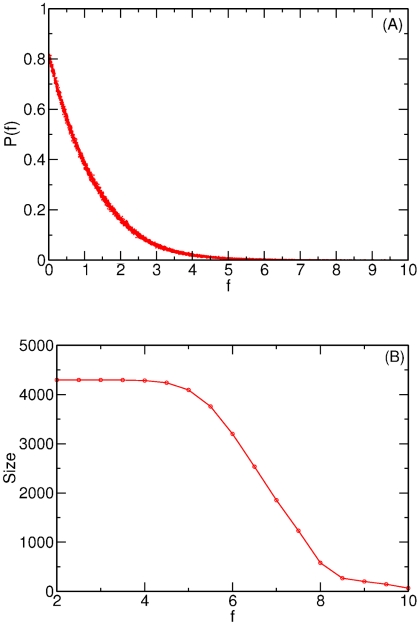
 , between pairs of genes in E. coli calculated using the CLR algorithm and the full
  dataset. (B) Size of the largest connected component for relatedness value,
  . At small values of
  the network is fully connected but begins to break up into multiple disconnected components at a critical value of approximately
  .
.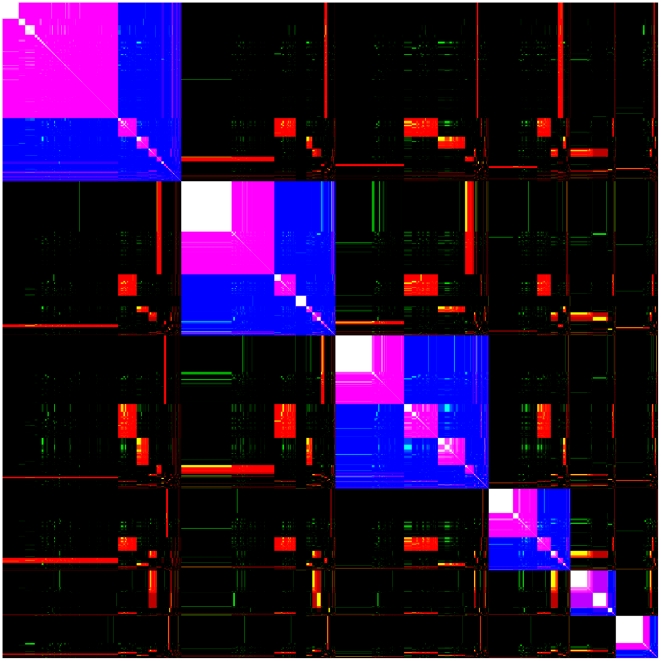
 is colored blue, red, or green if genes
  and
and  are in the same community at threshold values 2, 4 or 6, respectively. The density of the color indicates the strength of the correlation in the partitionings of the pair of genes. For example, considering the correlation between a pair of genes in the 10 replicate partitionings performed on the
  network, dark and light red indicates that the pair of genes are always and rarely found to be in the same community, respectively. The red, green and blue colors corresponding to
  thresholds, respectively, are combined to indicate the correlations of each pair of genes at all three threshold values. Thus, the color of the matrix element in the position
  is white if genes
  and
and  are in the same community at all three threshold values. It is purple (yellow) if the two genes are in the same community at thresholds 2 and 4 (4 and 6), but not at threshold 6 (2) and it is black if the two genes are not in the same community at any of the three threshold values. A list of the order of genes is given in Dataset S2. A full size version with each pixel representing a distinct pair of genes is given in Figure S1.
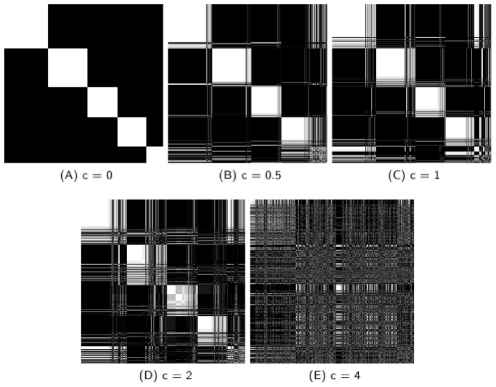
 (Figure 3A) are in the same order in Figure 3:B, C, D, and E. Within each of the five core communities of Figure 3A, the node order is allowed to change in Figure 3:B, C, D, and E in order to display the largest subcommunity first. For each panel, he list of of the order of genes and the core community they belong to is given in Dataset S5 and Dataset S6, respectively. A full size version with each pixel representing a distinct pair of genes is included in Figure S3.
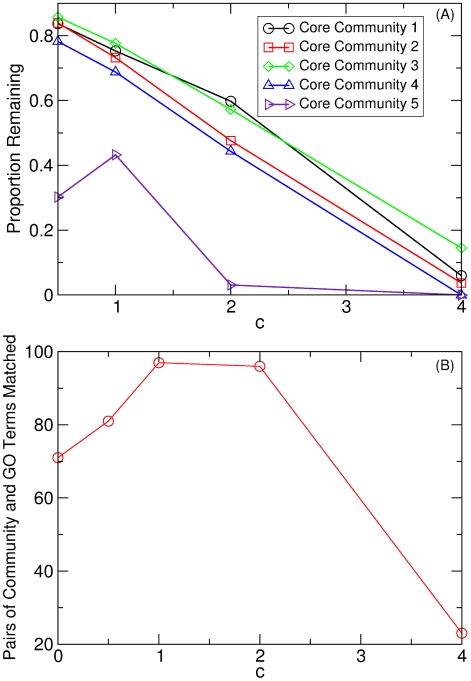
 core community nodes that remain in a core community. (B) The number of significant GO term enrichments as a function of noise level
  for networks constructed with
  . If a GO term is enriched by more than one community, each enrichment is counted separately.
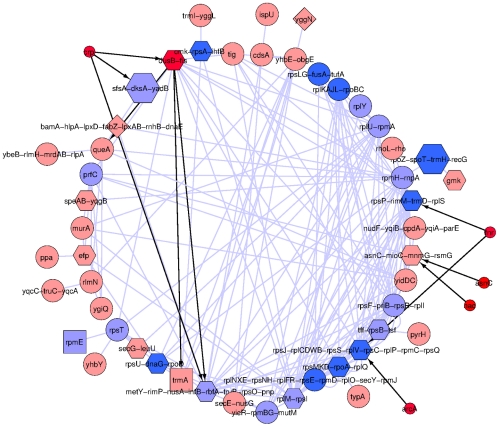
 promoter; diamond,
  promoter; square,
  promoter; circle, unknown sigma factor. Note that very few interactions observed in the CLR network can be explained by the direct interactions annotated in RegulonDB. The high proportion of ppGpp sensitive promoters among operons contained in the community suggests this molecule as a good candidate for regulating the remaining interactions. The network layout was determined by the circular layout option in Cytoscape 2.8.1, no particular significance should be attached to operons being outside the main circle.
Similar articles
-
The condition-dependent transcriptional network in Escherichia coli.Ann N Y Acad Sci. 2009 Mar;1158:29-35. doi: 10.1111/j.1749-6632.2008.03746.x. Ann N Y Acad Sci. 2009. PMID: 19348629
-
Reconstruction of Escherichia coli transcriptional regulatory networks via regulon-based associations.BMC Syst Biol. 2009 Apr 14;3:39. doi: 10.1186/1752-0509-3-39. BMC Syst Biol. 2009. PMID: 19366454 Free PMC article.
-
Comparative analysis of module-based versus direct methods for reverse-engineering transcriptional regulatory networks.BMC Syst Biol. 2009 May 7;3:49. doi: 10.1186/1752-0509-3-49. BMC Syst Biol. 2009. PMID: 19422680 Free PMC article.
-
Inferring regulatory networks.Front Biosci. 2008 Jan 1;13:263-75. doi: 10.2741/2677. Front Biosci. 2008. PMID: 17981545 Review.
-
PheNetic: network-based interpretation of unstructured gene lists in E. coli.Mol Biosyst. 2013 Jul;9(7):1594-603. doi: 10.1039/c3mb25551d. Epub 2013 Apr 16. Mol Biosyst. 2013. PMID: 23591551 Review.
Cited by
-
Data Mining a Medieval Medical Text Reveals Patterns in Ingredient Choice That Reflect Biological Activity against Infectious Agents.mBio. 2020 Feb 11;11(1):e03136-19. doi: 10.1128/mBio.03136-19. mBio. 2020. PMID: 32047130 Free PMC article.
-
Inferencing Bulk Tumor and Single-Cell Multi-Omics Regulatory Networks for Discovery of Biomarkers and Therapeutic Targets.Cells. 2022 Dec 26;12(1):101. doi: 10.3390/cells12010101. Cells. 2022. PMID: 36611894 Free PMC article. Review.
-
Analysis of the communities of an urban mobile phone network.PLoS One. 2017 Mar 23;12(3):e0174198. doi: 10.1371/journal.pone.0174198. eCollection 2017. PLoS One. 2017. PMID: 28334003 Free PMC article.
-
Network analysis of transcriptomics expands regulatory landscapes in Synechococcus sp. PCC 7002.Nucleic Acids Res. 2016 Oct 14;44(18):8810-8825. doi: 10.1093/nar/gkw737. Epub 2016 Aug 27. Nucleic Acids Res. 2016. PMID: 27568004 Free PMC article.
-
Diversity in lac Operon Regulation among Diverse Escherichia coli Isolates Depends on the Broader Genetic Background but Is Not Explained by Genetic Relatedness.mBio. 2019 Nov 12;10(6):e02232-19. doi: 10.1128/mBio.02232-19. mBio. 2019. PMID: 31719176 Free PMC article.
References
-
- Davidson EH, Rast JP, Oliveri P, Ransick A, Calestani C, et al. A genomic regulatory network for development. Science. 2002;295:1669–1678. - PubMed
Publication types
MeSH terms
Substances
LinkOut - more resources
Full Text Sources
