. 2012 Feb;8(2):e1002552.
doi: 10.1371/journal.ppat.1002552. Epub 2012 Feb 23.

Depletion of dendritic cells enhances innate anti-bacterial host defense through modulation of phagocyte homeostasis

Affiliations

Depletion of dendritic cells enhances innate anti-bacterial host defense through modulation of phagocyte homeostasis

Stella E Autenrieth et al. PLoS Pathog. 2012 Feb.

Abstract

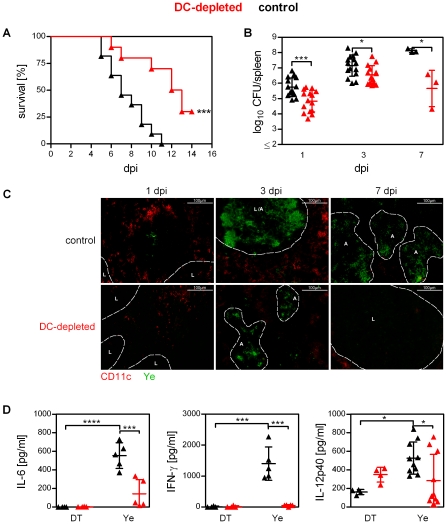
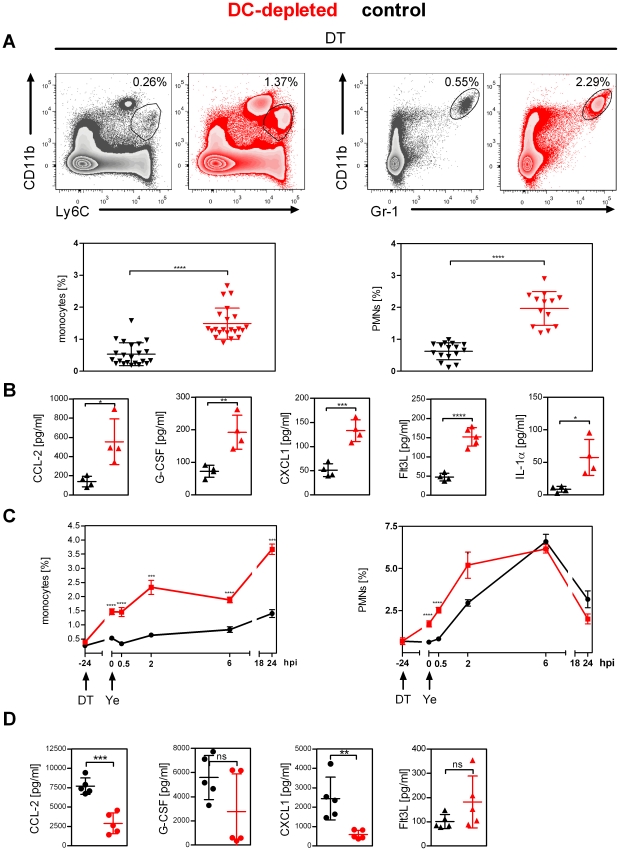
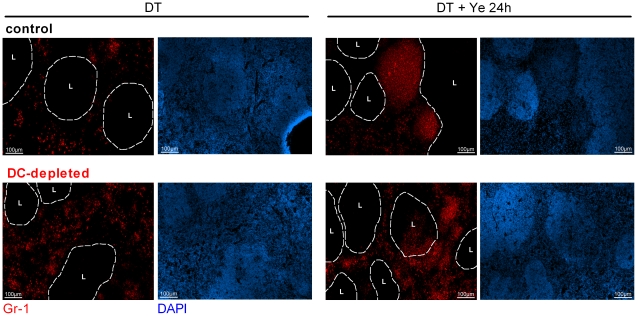
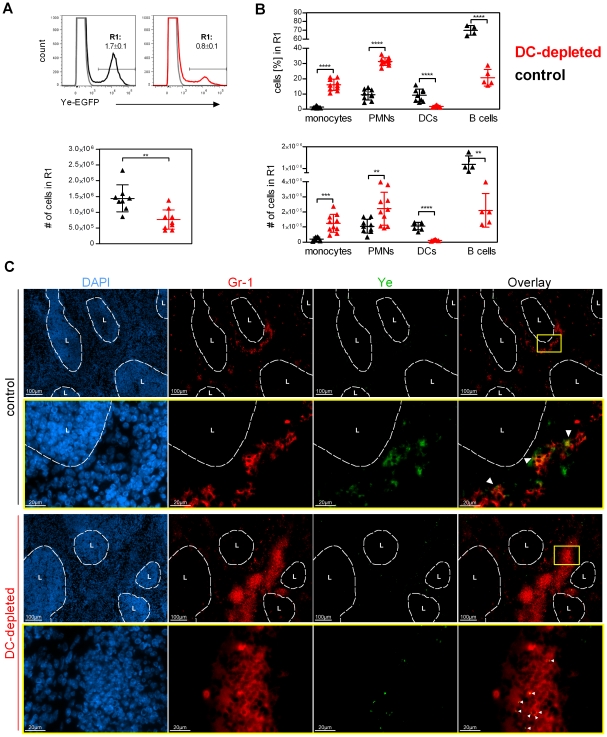
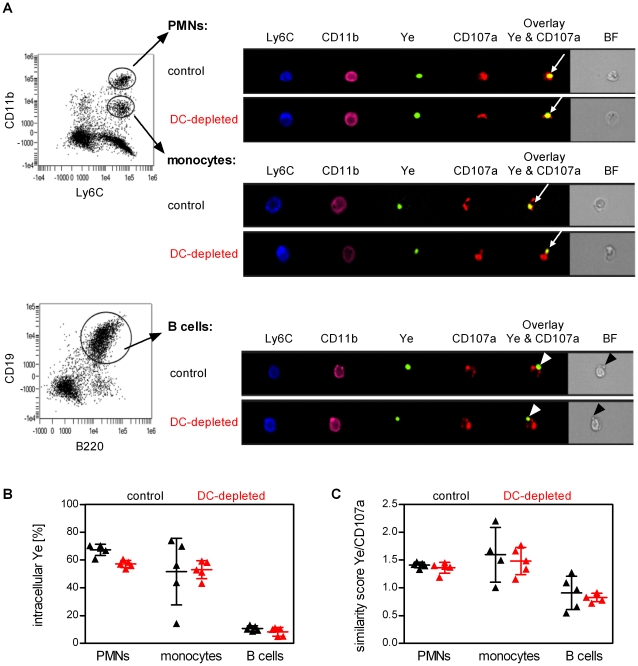
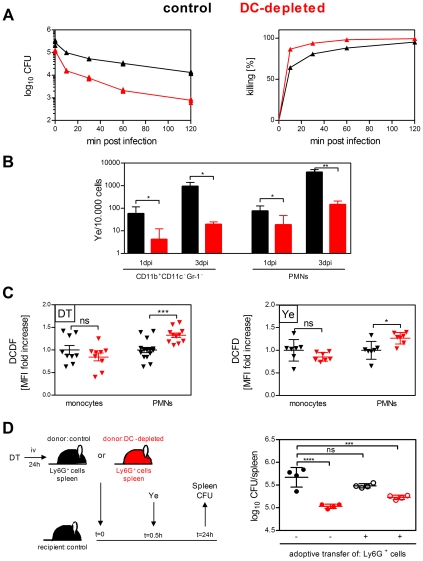
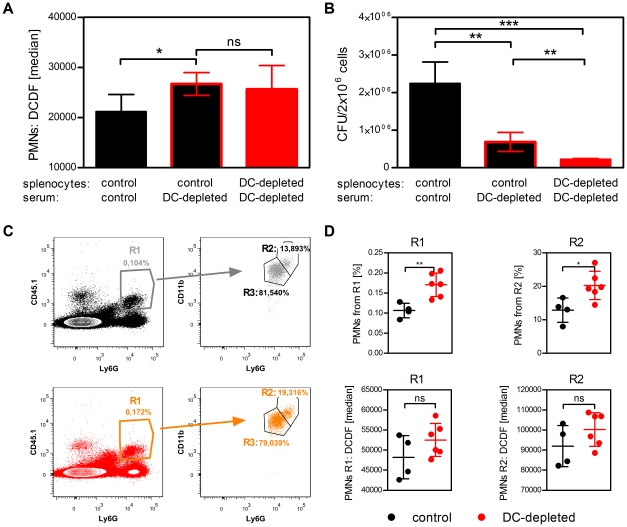
Dendritic cells (DCs) as professional antigen-presenting cells play an important role in the initiation and modulation of the adaptive immune response. However, their role in the innate immune response against bacterial infections is not completely defined. Here we have analyzed the role of DCs and their impact on the innate anti-bacterial host defense in an experimental infection model of Yersinia enterocolitica (Ye). We used CD11c-diphtheria toxin (DT) mice to deplete DCs prior to severe infection with Ye. DC depletion significantly increased animal survival after Ye infection. The bacterial load in the spleen of DC-depleted mice was significantly lower than that of control mice throughout the infection. DC depletion was accompanied by an increase in the serum levels of CXCL1, G-CSF, IL-1α, and CCL2 and an increase in the numbers of splenic phagocytes. Functionally, splenocytes from DC-depleted mice exhibited an increased bacterial killing capacity compared to splenocytes from control mice. Cellular studies further showed that this was due to an increased production of reactive oxygen species (ROS) by neutrophils. Adoptive transfer of neutrophils from DC-depleted mice into control mice prior to Ye infection reduced the bacterial load to the level of Ye-infected DC-depleted mice, suggesting that the increased number of phagocytes with additional ROS production account for the decreased bacterial load. Furthermore, after incubation with serum from DC-depleted mice splenocytes from control mice increased their bacterial killing capacity, most likely due to enhanced ROS production by neutrophils, indicating that serum factors from DC-depleted mice account for this effect. In summary, we could show that DC depletion triggers phagocyte accumulation in the spleen and enhances their anti-bacterial killing capacity upon bacterial infection.


Conflict of interest statement

The authors have declared that no competing interests exist.

Figures

Figure 1
Figure 1. Impact of DC depletion on the outcome of Ye infection.
DC-depleted (red symbols) and DT-treated control (black symbols) mice were injected i.v. with 5×10⁴ Ye pYV+ (A–D) and daily with diphtheria toxin (DT) starting one day before infection. (A) Survival mice infected as described above was monitored until day 14 after infection. *** p<0.005 (Log-rank (Mantel-Cox) test). (B) Bacterial load (CFU) in the spleen was assessed at the indicated days post infection by plating. Each symbol represents an individual mouse; horizontal lines indicate the mean ± SD. * indicates statistically significant differences (Student's t-test). (C) Immunohistochemical analysis of Ye (green) and DCs (red) in spleens, visualized by staining with polyclonal antiserum to Ye and Alexa Fluor 488-labeled secondary antibody followed by biotin-labeled monoclonal antibody to CD11c and Alexa Fluor 546-labeled streptavidin. Original magnification ×20; A: abscess, L: lymph follicle. (D) 24 h post DT treatment (DT) and 24 h post infection (Ye) serum was collected and concentrations of the indicated proinflammatory cytokines were analyzed by bioplex assay or ELISA. Each symbol represents an individual mouse; horizontal lines indicate the mean ± SD. * indicates statistically significant differences (one-way ANOVA with Bonferroni post test.). Data are from 2 to 4 (A and B 1 and 3 dpi) or representative of 2 (C and D) independent experiments.
Figure 2
Figure 2. Replacement of DCs by monocytes and neutrophils upon DC depletion.
(A–D) Mice were treated daily with diphtheria toxin (DT) (A and B) starting one day before infection and were injected with 5×10⁴ Ye pYV+ for 24 h (C and D). (A) Representative dot plots showing analysis of monocytes (left) and neutrophils (right) in spleen from control (black) and DC-depleted (red) mice. Numbers adjacent to outlined areas indicate frequency of monocytes and neutrophils. Graphs show the frequency of monocytes (left) and neutrophils (right) per spleen. (B) Bioplex assay or ELISA of chemokine concentrations in sera from control and DC-depleted mice 24 h after DT-treatment. (C) Flow cytometry analysis of the frequency of monocytes (left) and neutrophils (right) in the spleen at the indicated times post Ye infection. (D) Bioplex assay or ELISA of chemokine and cytokine concentrations in sera from control and DC-depleted mice 24 h after Ye infection. Each symbol represents an individual mouse; small horizontal lines indicate the mean ± SD. * indicates statistically significant differences between control and DC-depleted mice (Student's t-test). Data are from 5 (A) or one representative out of 2 or more (B, C and D) independent experiments.
Figure 3
Figure 3. Accumulation of neutrophils in the splenic red pulp upon DC depletion.
Immunohistochemical analysis of neutrophils (red) in the spleen 24 h post DT treatment (left) and 24 h Ye infection (right), visualized by staining with biotin-labeled monoclonal antibody to Gr-1 and Alexa Fluor 546-labeled streptavidin. Original magnification ×10. L: lymph follicle. Data are representative of 2 independent experiments. The lymph follicle region is defined by staining nuclei with DAPI (blue).
Figure 4
Figure 4. Ye are predominantly associated with phagocytes upon DC depletion.
(A) Flow cytometry analysis of Ye-GFP+ cells in spleens of DT-treated control (black symbols) and DC-depleted (red symbols) mice 30 min after injection of 5×10⁸ GFP-expressing Ye pYV+. Numbers adjacent to R1 indicate the frequency of Ye-GFP+ splenocytes. Graph shows the total number of Ye-GFP+ splenocytes (R1) per spleen. (B) Graphs show the frequency and total numbers (#) of Ye-GFP+ cells (R1 from A) being monocytes, neutrophils, DCs, and B cells. Each symbol represents an individual mouse; horizontal lines indicate the mean ± SD. * indicates statistically significant differences (Student's t-test). (C) Immunohistochemical analysis of Ye (green) and neutrophils (red) in the spleen of DT-treated control mice (black) and DC-depleted mice (red) infected as described in (A), visualized by staining with polyclonal antiserum to Ye and Alexa Fluor 488-labeled secondary antibody followed by biotin-labeled monoclonal antibody to Gr-1 and Alexa Fluor 546-labeled streptavidin. The lymph follicle region is defined by staining nuclei with DAPI (blue). Original magnification ×10 (top row) and ×63 (bottom row). L: lymph follicle. Arrows indicate Ye associated with Gr-1+ cells. Data are from 2 independent experiments.
Figure 5
Figure 5. DC depletion does not enhance bacterial uptake.
Multispectral imaging flow cytometry analysis of Ye-GFP+ cells in splenocytes of DT-treated control (black symbols) and DC-depleted (red symbols) mice 30 min after injection of 5×10⁸ GFP-expressing Ye pYV+. (A) Dot plots show gating of neutrophils, monocytes, and B cells. Microscopic pictures show representative neutrophils, monocytes, and B cells from DC-depleted or control mice harboring Ye and stained additionally with the lysosomal marker CD107a. Arrows indicate intracellular Ye, arrowheads extracellular Ye. Quantitative analysis of intracellular Ye (B, defined as described in Materials and Methods) or similarity score of eGFP-Ye and CD107a (C) in neutrophils, monocytes, and B cells from DC-depleted or control mice. Each symbol represents an individual mouse; horizontal lines indicate the mean ± SD. Data are from one out of two independent experiments with similar results.
Figure 6
Figure 6. Phagocytes from DC-depleted mice are more effective in bacterial killing.
(A) Splenocytes from DT-treated control (black symbols) and DC-depleted (red symbols) mice were incubated in vitro with Ye (MOI 1) for 10 min. Cells were extensively washed and either plated directly on MH agar plates or incubated further in the presence of gentamicin for the indicated time points before plating. The diagrams show the CFU as log scale (left) and the frequency of killed Ye (right) from one representative out of two experiments with quintuplicates including mean ± SD. (B) Viable intracellular Yersinia from sorted CD11b+Gr-1 spleen cells or neutrophils of DT-treated control (black symbols) and DC-depleted (red symbols) mice injected with 5×10⁴ Ye pYV+ were analyzed by plating serial dilutions 1 and 3 dpi. CFU were analyzed per 10.000 sorted spleen cells. Data are from two independent experiments with three to six mice per group (mean ± SD). * indicates statistically significant differences (Student's t-test). (C) Flow cytometry analyses of ROS production in monocytes and neutrophils from DT-treated control (black symbols) and DC-depleted (red symbols) uninfected mice (left diagram) or injected for 2 h with 5×10⁴ Ye pYV+ (right diagram) using 2′, 7′-Dichlorofluorescin diacetate reagent (DCFD). The graph shows fold increase of median fluorescence intensity of DCFD in monocytes and neutrophils from DC-depleted mice compared to control mice. Each symbol represents an individual mouse; horizontal lines indicate the mean ± SD. * indicates statistically significant differences (one-way ANOVA with Bonferroni post test). Data are from 6 independent experiments. (D) Splenic neutrophils from DT-treated control mice (black open circles) or DC-depleted mice (red open circles) were purified, adoptively transferred into control mice and infected with 5×10⁴ Ye 30 min later. Control (black circles) or DC-depleted (red circles) mice received PBS instead of neutrophils. The CFU per spleen were analyzed by plating serial dilutions 1 dpi. Each symbol represents an individual mouse; horizontal lines indicate the mean ± SD. Data are from one out of three independent experiments with similar results (three to five mice per group). * indicates statistically significant differences compared to control mice without adoptive transfer (one-way ANOVA with Bonferroni post test).
Figure 7
Figure 7. Serum factors from DC-depleted mice increase ROS production by neutrophils and enhance their killing capacity.
(A) Splenocytes from control or DC-depleted mice were incubated with serum from DT-treated control or DC-depleted mice in medium (1∶5) for 1 h, followed by flow cytometry analyses of ROS production in neutrophils using DCFD. The graph shows the median fluorescence intensity of DCFD in neutrophils. Bars indicate the mean ± SD of triplicates. Data are the combination of 2 independent experiments. * indicates statistically significant differences (one-way ANOVA with Bonferroni post test). (B) Splenocytes were incubated with serum as described in (A) and incubated in vitro with Ye (MOI 1) for 10 min and plated directly on MH agar plates. The graph shows the CFU of triplicates including mean ± SD. * indicates statistically significant differences (one-way ANOVA with Bonferroni post test). Data are from one out of three independent experiments with similar results. (C) Neutrophils from CD45.1 mice were adoptively transferred into control (upper panel) or DC-depleted mice (lower panel). Flow cytometry analysis of transferred CD45.1+Ly6G+ neutrophils was performed 2 h after transfer. Numbers adjacent to outlined areas indicate frequency of transferred CD45.1+Ly6G+ neutrophils (R1), CD45.1+CD11bhiLy6Ghi neutrophils (R2), and CD45.1+CD11b+Ly6G+ neutrophils (R3). (D) Frequency of (upper panel) and ROS production by (lower panel) transferred neutrophils (R1 and R2) as described in (C) was analyzed 2 h post neutrophil transfer. Each symbol represents an individual mouse; horizontal lines indicate the mean ± SD. * indicates statistically significant differences (Student's t-test). Data are from one out of two (C and D) independent experiments with similar results.
Figure 8
Figure 8. DC depletion decreases bacterial load upon bacterial infection.
DC-depleted (red circles) and DT-treated control (black circles) mice were injected with 5×10⁴ S. typhimurium, 5×10⁷ E. coli or 5×10⁴ L. monocytogenes for 2 h. (A) Flow cytometry analyses of ROS production in neutrophils 2 h post infection using DCFD. The graphs show the median fluorescence intensity of DCFD. Each symbol represents an individual mouse; horizontal lines indicate the mean ± SD. * indicates statistically significant differences (Student's t-test). Data are from 1 or 2 independent experiments. (B) Bacterial load (CFU) in the spleen was determined 2 h post infection by plating. Each symbol represents an individual mouse; horizontal lines indicate the mean ± SD. * indicates statistically significant differences (Student's t-test). Data are from 1 experiment.

Similar articles

Cited by

References

    1. Fearon DT, Locksley RM. The instructive role of innate immunity in the acquired immune response. Science. 1996;272:50–53. - PubMed
    1. Hoffmann JA, Kafatos FC, Janeway CA, Ezekowitz RA. Phylogenetic perspectives in innate immunity. Science. 1999;284:1313–1318. - PubMed
    1. Medzhitov R, Janeway CA., Jr Innate immunity: impact on the adaptive immune response. Curr Opin Immunol. 1997;9:4–9. - PubMed
    1. Banchereau J, Steinman RM. Dendritic cells and the control of immunity. Nature. 1998;392:245–252. - PubMed
    1. Bell D, Young JW, Banchereau J. Dendritic cells. Adv Immunol. 1999;72:255–324. - PubMed

Publication types