. 2012 Feb;8(2):e1002556.
doi: 10.1371/journal.ppat.1002556. Epub 2012 Feb 23.

Characterization of monomeric intermediates during VSV glycoprotein structural transition

Affiliations

Characterization of monomeric intermediates during VSV glycoprotein structural transition

Aurélie A Albertini et al. PLoS Pathog. 2012 Feb.

Abstract

Entry of enveloped viruses requires fusion of viral and cellular membranes, driven by conformational changes of viral glycoproteins. Crystal structures provide static pictures of pre- and post-fusion conformations of these proteins but the transition pathway remains elusive. Here, using several biophysical techniques, including analytical ultracentrifugation, circular dichroïsm, electron microscopy and small angle X-ray scattering, we have characterized the low-pH-induced fusogenic structural transition of a soluble form of vesicular stomatitis virus (VSV) glycoprotein G ectodomain (G(th), aa residues 1-422, the fragment that was previously crystallized). While the post-fusion trimer is the major species detected at low pH, the pre-fusion trimer is not detected in solution. Rather, at high pH, G(th) is a flexible monomer that explores a large conformational space. The monomeric population exhibits a marked pH-dependence and adopts more elongated conformations when pH decreases. Furthermore, large relative movements of domains are detected in absence of significant secondary structure modification. Solution studies are complemented by electron micrographs of negatively stained viral particles in which monomeric ectodomains of G are observed at the viral surface at both pH 7.5 and pH 6.7. We propose that the monomers are intermediates during the conformational change and thus that VSV G trimers dissociate at the viral surface during the structural transition.


Conflict of interest statement

The authors have declared that no competing interests exist.

Figures

Figure 1
Figure 1. VSV G ectodomain structural transition.
(A) Flotation of Gth with liposomes over a range of pH values from 5.7 to 8.8. For each experiment, top fraction (t) and bottom fraction (b) were collected and analyzed on 10% SDS PAGE stained with Coomassie Blue. The experiment “rev” shows the reversibility of the low-pH-induced association of Gth with liposomes after a re-incubation at pH 8.8. (B) Circular dichroïsm spectra of Gth at pH 8.8 (blue), pH 6.7 (orange) and pH 5.7 (red). Protein spectra were recorded at 15°C in 100 mM potassium phosphate buffer at a protein concentration of 0.8 mg/ml. (C) Plot of Gth ellipticity (measured at 200 nm) as a function of pH.
Figure 2
Figure 2. Analytical ultracentrifugation analysis of Gth at different pH values.
The figure shows the experimental scans and data fitting curves (represented by a solid line) resulting from the analysis with Sedfit software (top panels) together with sedimentation coefficient distributions (bottom panels). Samples were spun at 45,000 rpm for Gth incubated at pH 8.8, pH 7.5 and pH 6.7 and at 20,000 rpm for Gth incubated at pH 5.7.
Figure 3
Figure 3. SAXS analysis of Gth in solution.
(A) SAXS patterns of Gth at pH 8.8 (blue) and pH 7.5 (red). Scattering intensities are plotted against the momentum transfer q. The insets zoom on ranges of maximal differences between the two curves. Notice the color swap: blue curve above (resp. below) red one in the first (resp. second) inset. (B) Guinier plots calculated from the SAXS data shown in (A). (C) Distance distribution functions p(r) computed from SAXS experimental data at pH 8.8 (blue) and pH 7.5 (red).
Figure 4
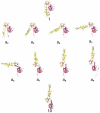
Figure 4. Models of structural intermediates during Gth structural transition.
Conformation 1 is the Gth protomer found in the pre-fusion crystalline structure, conformation 10 is the Gth protomer found in the post-fusion crystalline structure. Conformations a2 to a9 were modeled using the Yale morph server (http://www.molmovdb.org/molmovdb/morph/). Gth molecule is colored by domains (lateral domain in red, oligomerization domain in blue, PH domain in orange and fusion domain in yellow) with the fusion loops in green and the C-terminus in pink.
Figure 5
Figure 5. Fit of experimental SAXS patterns using linear combinations of calculated scattering curves from models shown in Figure 4 .
Panel A: pH 8.8; Panel B: pH 7.5. In each panel, top left frame: experimental scattering pattern (black dots) and the best fit from Oligomer (continuous blue or red line). Bottom left frame: distribution of reduced residuals ((Iexp(q)−Icalc(q))/σexp(q)). Top right frame: histogram of the fractional concentrations of each conformation expressed in % of the total population. The distributions of reduced residuals between the best linear combination and the experimental curves although not flat and not restricted to the [−2, +2] band, notably in the smallest angle part, are much less structured than that of the two-structure fits (Figure S2).
Figure 6
Figure 6. Electron microscopy on negatively stained Gth at pH 7.5, pH 6.7 and pH 5.7.
(A) At pH 7.5, no oligomer of Gth is detected and a definite molecular shape cannot be identified. (B) At pH 6.7 a few Gth assemblies can be detected. (C) At pH 5.7 Gth trimers are observed assembled either in lattice via lateral interactions or in rosette-like assemblies. Protein concentration was 0.1 mg/mL for all 3 samples. The scale bar is for 100 nm. (D) Close up view of Gth rosettes observed at pH 6.7 and 5.7. Notice the differences in the aspect of the protein assemblies. The scale bar is for 20 nm.
Figure 7
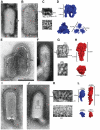
Figure 7. Morphology of G at the surface of negatively stained VSV particles at pH 7.5, 6.7 and 6.0.
(A–B) VSV particles incubated at pH 7.5. G molecules form a thin and continuous layer of 8 nm height all around the viral particle. The white bars in A indicate areas where an even layer of G is visible. The circle on the viral particle in B shows a pre-fusion trimer of G in top view (Note that only a few trimers are visible). (C) Higher magnification of G layer region indicated by an asterisk in A (top) and of G pre-fusion trimer in top view located inside the circle in B (bottom). (D) Space filling model of VSV G X-ray trimer in its pre-fusion conformation as viewed from the side and from the top. The top view on the right is a clipped view of VSV G that illustrates what G pre-fusion trimers looks like at the viral surface. (E–F) VSV particles incubated at pH 6.0. Spikes are more elongated and can easily be seen individually. Arrowheads indicate some individual post-fusion trimers viewed from the side. Note that in panel F their regular spacing is particularly visible. Spikes can also be seen from the top in F, forming white domains having a diameter of about 7 nm. (G) Higher magnification of the region indicated by an asterisk on E showing spikes viewed from the side (top) and of the boxed region in F showing post-fusion trimers viewed from the top. (H) Space filling model of VSV G trimer in its post-fusion conformation as viewed from the side and from the top. (I–J) VSV particles briefly incubated at pH 6.7. G molecules form an irregular layer all around the viral particle. The white bar in I indicates an area with a layer of G that have kept their high-pH organization. The arrowhead in I points to a spike in its post-fusion conformation. The black line in I indicates an area where G forms a fuzzy heterogeneous layer in which some elongated rod like shape structures can be observed. Glycoproteins can also be seen from the top in J, forming small white domains having a diameter of about 4 nm. (K) Higher magnifications of G layer region indicated by an asterisk in I (top) and of the boxed region in J showing top views of G at the viral surface (bottom). (L) Space filling model of VSV G protomer in pre-fusion (in blue) and post-fusion (in red) conformations as viewed from the side and from the top. All VSV particles (A, B, E, F, I, J) are at the same scale (scale bar for 100 nm n in E). The images in C, G, and K are enlargements of these particles (magnification X4). Measurements and membrane location (m) are indicated.
Figure 8
Figure 8. Pathway for the pH-dependent structural transition of G in solution and at the viral surface.
(A) Gth species detected in solution at various pH. From pH 8.8 to pH 7.5 only monomers of Gth are present. pH decrease leads to monomers adopting in increasing number elongated shapes with the fusion loops exposed at the top of the protein. At pH 6.7, at low protein concentration, trimerization does not occur and Gth monomers associate to form rosettes through interaction via their fusion loops. Note that in this putative elongated conformation, C-terminal part (in magenta) and fusion loops are located at opposite extremities of the molecule and thus the C-terminal part cannot interfere with rosette formation through fusion loops aggregation. At still lower pH, monomers complete their refolding and reassociate to form post-fusion trimers. Gth post-fusion trimers have a strong tendency to interact through their fusion loops to form dimers of trimers and rosettes. (B) Plausible structural transition pathway of G at the viral surface. At pH 7.5, pre-fusion trimers and flexible monomers are in equilibrium at the viral surface. Lowering the pH to 6.7 favors the formation of elongated monomers oblique to the viral membrane with the fusion loops exposed at the top of the protein that favor an initial interaction of G with the target membrane. Some post-fusion trimers are already visible. At pH 6.0, all monomers have completed their refolding and reassociated to form post-fusion trimers that are regularly spaced at the viral surface. Color code for Gth is the same than in Figure 4.

Similar articles

Cited by

References

    1. Bullough PA, Hughson FM, Skehel JJ, Wiley DC. Structure of influenza haemagglutinin at the pH of membrane fusion. Nature. 1994;371:37–43. - PubMed
    1. Harrison SC. Viral membrane fusion. Nat Struct Mol Biol. 2008;15:690–698. - PMC - PubMed
    1. Skehel JJ, Wiley DC. Coiled coils in both intracellular vesicle and viral membrane fusion. Cell. 1998;95:871–874. - PubMed
    1. Rey FA, Heinz FX, Mandl C, Kunz C, Harrison SC. The envelope glycoprotein from tick-borne encephalitis virus at 2 A resolution. Nature. 1995;375:291–298. - PubMed
    1. Kielian M, Rey FA. Virus membrane-fusion proteins: more than one way to make a hairpin. Nat Rev Microbiol. 2006;4:67–76. - PMC - PubMed

Publication types

MeSH terms