. 2012;8(2):e1002505.
doi: 10.1371/journal.pgen.1002505. Epub 2012 Feb 23.

Coexpression network analysis in abdominal and gluteal adipose tissue reveals regulatory genetic loci for metabolic syndrome and related phenotypes

Affiliations

Coexpression network analysis in abdominal and gluteal adipose tissue reveals regulatory genetic loci for metabolic syndrome and related phenotypes

Josine L Min et al. PLoS Genet. 2012.

Abstract

Metabolic Syndrome (MetS) is highly prevalent and has considerable public health impact, but its underlying genetic factors remain elusive. To identify gene networks involved in MetS, we conducted whole-genome expression and genotype profiling on abdominal (ABD) and gluteal (GLU) adipose tissue, and whole blood (WB), from 29 MetS cases and 44 controls. Co-expression network analysis for each tissue independently identified nine, six, and zero MetS-associated modules of coexpressed genes in ABD, GLU, and WB, respectively. Of 8,992 probesets expressed in ABD or GLU, 685 (7.6%) were expressed in ABD and 51 (0.6%) in GLU only. Differential eigengene network analysis of 8,256 shared probesets detected 22 shared modules with high preservation across adipose depots (D(ABD-GLU) = 0.89), seven of which were associated with MetS (FDR P<0.01). The strongest associated module, significantly enriched for immune response-related processes, contained 94/620 (15%) genes with inter-depot differences. In an independent cohort of 145/141 twins with ABD and WB longitudinal expression data, median variability in ABD due to familiality was greater for MetS-associated versus un-associated modules (ABD: 0.48 versus 0.18, P = 0.08; GLU: 0.54 versus 0.20, P = 7.8×10(-4)). Cis-eQTL analysis of probesets associated with MetS (FDR P<0.01) and/or inter-depot differences (FDR P<0.01) provided evidence for 32 eQTLs. Corresponding eSNPs were tested for association with MetS-related phenotypes in two GWAS of >100,000 individuals; rs10282458, affecting expression of RARRES2 (encoding chemerin), was associated with body mass index (BMI) (P = 6.0×10(-4)); and rs2395185, affecting inter-depot differences of HLA-DRB1 expression, was associated with high-density lipoprotein (P = 8.7×10(-4)) and BMI-adjusted waist-to-hip ratio (P = 2.4×10(-4)). Since many genes and their interactions influence complex traits such as MetS, integrated analysis of genotypes and coexpression networks across multiple tissues relevant to clinical traits is an efficient strategy to identify novel associations.


Conflict of interest statement

The authors have declared that no competing interests exist.

Figures

Figure 1
Figure 1. Gene expression changes related to MetS in ABD and GLU.
A,B. Heatmap of scaled expression values of 893 and 335 differentially expressed genes between MetS cases and controls in ABD (A) and GLU (B) samples. The dendogram depicts hierarchical clustering of the differentially expressed genes. The bottom bars show black boxes for MetS, the presence of the MetS components (reduced HDL, raised TG, raised fasting glucose, raised blood pressure) and gender (females). C. The top 10 genes differentially expressed in ABD and the top 10 genes differentially expressed in GLU. The horizontal bars displays −log10 Pvalues for differential expression between MetS cases and controls in ABD and GLU and between depots.
Figure 2
Figure 2. MetS-associated modules found in the different fat depots.
Visualization of the ABD brown (A), GLU darkgreen (B), consensus yellow in ABD (C) and consensus yellow in GLU (D) modules, respectively. For each module the top 150 pairwise correlations (intramodular connectivities) are shown. Genes with the top 10 highest ranked module membership are displayed in larger circles.
Figure 3
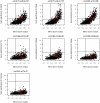
Figure 3. Scatterplot between MM (x-axis) and gene significance (y-axis) for MetS and the six MetS components in the ABD brown module.
Gene significance was defined as −log10 pvalue of the probeset-clinical trait association for each gene in the brown module. Gene expression probesets marked in red showed evidence for a cis eQTL, and their eSNPs were examined for association with BMI, HDL and TG (Table 4).
Figure 4
Figure 4. Sources of gene expression variation in different tissues.
A) 626 probesets associated with MetS in MolOBB ABD B) 205 probesets associated with MetS in MolOBB GLU. Variances are decomposed in MolTWIN ABD and WB.
Figure 5
Figure 5. Sources of variation for module eigengenes.
Median estimates from: A) MolTWIN ABD and B) MolTWIN WB. From left to right: eigengenes in MolTWIN are calculated from MolOBB ABD, GLU and WB probesets. In each plot, eigengenes are ordered by decreasing association with MetS from left to right (modules significantly associated with MetS are marked with * above the bar). Red is familiality, green is individual environment, cyan is individual visit, blue is common visit and grey displays residual variance.

Similar articles

Cited by

  • Altered intragenic DNA methylation of HOOK2 gene in adipose tissue from individuals with obesity and type 2 diabetes.
    Rodríguez-Rodero S, Menéndez-Torre E, Fernández-Bayón G, Morales-Sánchez P, Sanz L, Turienzo E, González JJ, Martinez-Faedo C, Suarez-Gutiérrez L, Ares J, Díaz-Naya L, Martin-Nieto A, Fernández-Morera JL, Fraga MF, Delgado-Álvarez E. Rodríguez-Rodero S, et al. PLoS One. 2017 Dec 11;12(12):e0189153. doi: 10.1371/journal.pone.0189153. eCollection 2017. PLoS One. 2017. PMID: 29228058 Free PMC article.
  • Inter-Tissue Gene Co-Expression Networks between Metabolically Healthy and Unhealthy Obese Individuals.
    Kogelman LJ, Fu J, Franke L, Greve JW, Hofker M, Rensen SS, Kadarmideen HN. Kogelman LJ, et al. PLoS One. 2016 Dec 1;11(12):e0167519. doi: 10.1371/journal.pone.0167519. eCollection 2016. PLoS One. 2016. PMID: 27907186 Free PMC article.
  • Sharing and Specificity of Co-expression Networks across 35 Human Tissues.
    Pierson E; GTEx Consortium; Koller D, Battle A, Mostafavi S, Ardlie KG, Getz G, Wright FA, Kellis M, Volpi S, Dermitzakis ET. Pierson E, et al. PLoS Comput Biol. 2015 May 13;11(5):e1004220. doi: 10.1371/journal.pcbi.1004220. eCollection 2015 May. PLoS Comput Biol. 2015. PMID: 25970446 Free PMC article.
  • New loci for body fat percentage reveal link between adiposity and cardiometabolic disease risk.
    Lu Y, Day FR, Gustafsson S, Buchkovich ML, Na J, Bataille V, Cousminer DL, Dastani Z, Drong AW, Esko T, Evans DM, Falchi M, Feitosa MF, Ferreira T, Hedman ÅK, Haring R, Hysi PG, Iles MM, Justice AE, Kanoni S, Lagou V, Li R, Li X, Locke A, Lu C, Mägi R, Perry JR, Pers TH, Qi Q, Sanna M, Schmidt EM, Scott WR, Shungin D, Teumer A, Vinkhuyzen AA, Walker RW, Westra HJ, Zhang M, Zhang W, Zhao JH, Zhu Z, Afzal U, Ahluwalia TS, Bakker SJ, Bellis C, Bonnefond A, Borodulin K, Buchman AS, Cederholm T, Choh AC, Choi HJ, Curran JE, de Groot LC, De Jager PL, Dhonukshe-Rutten RA, Enneman AW, Eury E, Evans DS, Forsen T, Friedrich N, Fumeron F, Garcia ME, Gärtner S, Han BG, Havulinna AS, Hayward C, Hernandez D, Hillege H, Ittermann T, Kent JW, Kolcic I, Laatikainen T, Lahti J, Mateo Leach I, Lee CG, Lee JY, Liu T, Liu Y, Lobbens S, Loh M, Lyytikäinen LP, Medina-Gomez C, Michaëlsson K, Nalls MA, Nielson CM, Oozageer L, Pascoe L, Paternoster L, Polašek O, Ripatti S, Sarzynski MA, Shin CS, Narančić NS, Spira D, Srikanth P, Steinhagen-Thiessen E, Sung YJ, Swart KM, Taittonen L, Tanaka T, Tikkanen E, van der Velde N, van Schoor NM, Verweij N, Wright AF, Yu L, Zmuda JM, Eklund N, Forrester T, Grarup N, … See abstract for full author list ➔ Lu Y, et al. Nat Commun. 2016 Feb 1;7:10495. doi: 10.1038/ncomms10495. Nat Commun. 2016. PMID: 26833246 Free PMC article.
  • Hypothalamic transcriptomes of 99 mouse strains reveal trans eQTL hotspots, splicing QTLs and novel non-coding genes.
    Hasin-Brumshtein Y, Khan AH, Hormozdiari F, Pan C, Parks BW, Petyuk VA, Piehowski PD, Brümmer A, Pellegrini M, Xiao X, Eskin E, Smith RD, Lusis AJ, Smith DJ. Hasin-Brumshtein Y, et al. Elife. 2016 Sep 13;5:e15614. doi: 10.7554/eLife.15614. Elife. 2016. PMID: 27623010 Free PMC article.

References

    1. Loos RJ, Lindgren CM, Li S, Wheeler E, Zhao JH, et al. Common variants near MC4R are associated with fat mass, weight and risk of obesity. Nat Genet. 2008;40:768–775. - PMC - PubMed
    1. Willer CJ, Speliotes EK, Loos RJ, Li S, Lindgren CM, et al. Six new loci associated with body mass index highlight a neuronal influence on body weight regulation. Nat Genet. 2009;41:25–34. - PMC - PubMed
    1. Speliotes EK, Willer CJ, Berndt SI, Monda KL, Thorleifsson G, et al. Association analyses of 249,796 individuals reveal 18 new loci associated with body mass index. Nat Genet. 2010;42:937–948. - PMC - PubMed
    1. Teslovich TM, Musunuru K, Smith AV, Edmondson AC, Stylianou IM, et al. Biological, clinical and population relevance of 95 loci for blood lipids. Nature. 2010;466:707–713. - PMC - PubMed
    1. Levy D, Ehret GB, Rice K, Verwoert GC, Launer LJ, et al. Genome-wide association study of blood pressure and hypertension. Nat Genet. 2009;41:677–687. - PMC - PubMed

Publication types