. 2012;8(2):e1002524.
doi: 10.1371/journal.pgen.1002524. Epub 2012 Feb 23.

Loss of Tgif function causes holoprosencephaly by disrupting the SHH signaling pathway

Affiliations

Loss of Tgif function causes holoprosencephaly by disrupting the SHH signaling pathway

Kenichiro Taniguchi et al. PLoS Genet. 2012.

Abstract

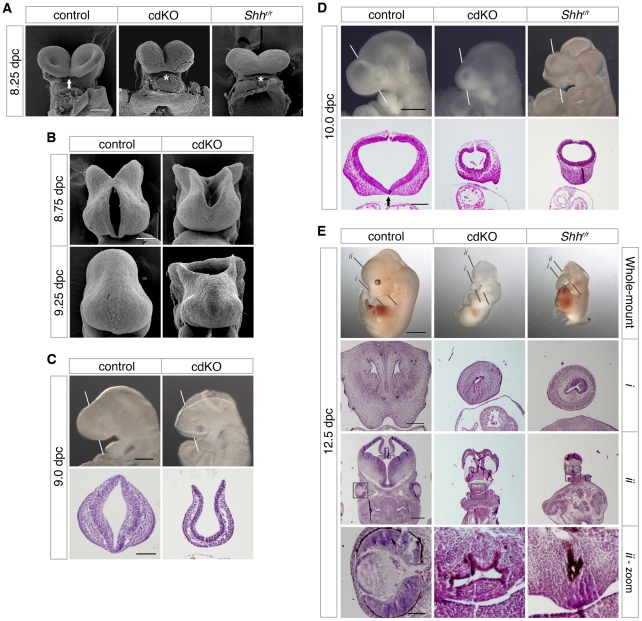
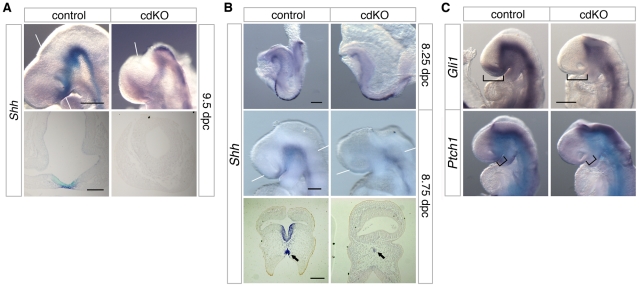
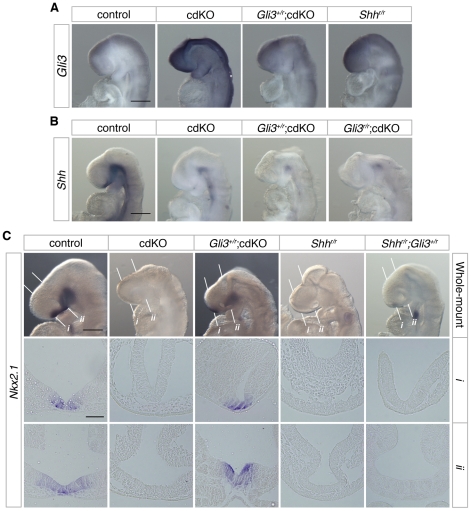
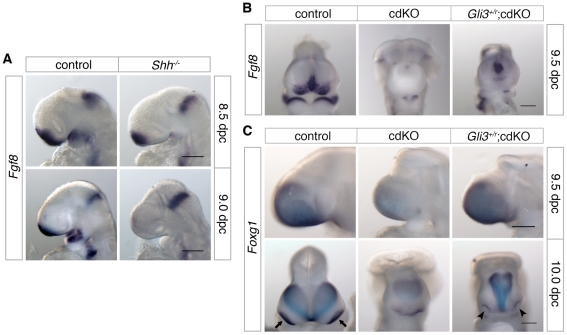
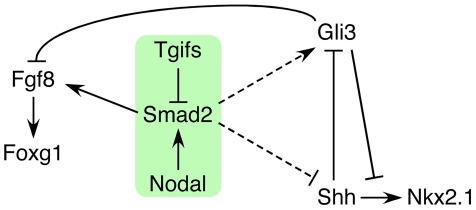
Holoprosencephaly (HPE) is a severe human genetic disease affecting craniofacial development, with an incidence of up to 1/250 human conceptions and 1.3 per 10,000 live births. Mutations in the Sonic Hedgehog (SHH) gene result in HPE in humans and mice, and the Shh pathway is targeted by other mutations that cause HPE. However, at least 12 loci are associated with HPE in humans, suggesting that defects in other pathways contribute to this disease. Although the TGIF1 (TG-interacting factor) gene maps to the HPE4 locus, and heterozygous loss of function TGIF1 mutations are associated with HPE, mouse models have not yet explained how loss of Tgif1 causes HPE. Using a conditional Tgif1 allele, we show that mouse embryos lacking both Tgif1 and the related Tgif2 have HPE-like phenotypes reminiscent of Shh null embryos. Eye and nasal field separation is defective, and forebrain patterning is disrupted in embryos lacking both Tgifs. Early anterior patterning is relatively normal, but expression of Shh is reduced in the forebrain, and Gli3 expression is up-regulated throughout the neural tube. Gli3 acts primarily as an antagonist of Shh function, and the introduction of a heterozygous Gli3 mutation into embryos lacking both Tgif genes partially rescues Shh signaling, nasal field separation, and HPE. Tgif1 and Tgif2 are transcriptional repressors that limit Transforming Growth Factor β/Nodal signaling, and we show that reducing Nodal signaling in embryos lacking both Tgifs reduces the severity of HPE and partially restores the output of Shh signaling. Together, these results support a model in which Tgif function limits Nodal signaling to maintain the appropriate output of the Shh pathway in the forebrain. These data show for the first time that Tgif1 mutation in mouse contributes to HPE pathogenesis and provide evidence that this is due to disruption of the Shh pathway.


Conflict of interest statement

The authors have declared that no competing interests exist.

Figures

Figure 1
Figure 1. Analysis of the HPE phenotype in cdKO embryos.
(A) Scanning electron microscopy (SEM) images of the frontal anterior view of embryos at 8.25 dpc, from Tgif1;Tgif2 conditional double intercrosses with epiblast specific deletion of the conditional Tgif1 allele (referred to as cdKO), Shh mutant intercrosses and a stage matched control are shown. The genotype of the control embryos is not indicated as they are representative of normal embryos from these crosses. The arrow indicates the separation of ventral lips of the cephalic folds in the control, that is defective in the cdKO and Shh null (marked by asterisks). Note, the conditional Shh null allele is referred to as ‘r’, for recombined. (B) SEM images of the frontal view of the forebrain of control and cdKO embryos at 8.75 and 9.25 dpc are shown. (C and D) Whole-mount images and hematoxylin and eosin (H&E) stained coronal section of fixed and paraffin-embedded control and cdKO embryos at 9.0 (C) and control, cdKO and Shhr/r at 10.0 dpc (D). The white lines indicate the plane of the coronal sections through the forebrain vesicle. Embryos are representative of at least 3 analyzed. In D, the division of the nasal field by the neuroepithelium is marked by an arrow. Note the continuous thickened layer of surface ectoderm in the mutants. (E) Whole mount images and H&E stained sections of fixed and paraffin-embedded control, cdKO and Shh null embryos at 12.5 dpc are shown. The two planes of section are indicated in the upper panels, and a magnified view of the eye is shown at the bottom (boxed region in section ii). Only two cdKO embryos were identified at this stage. Scale bars: 100 µm in A and B; 250 µm for whole-mount and 100 µm for section in C; 500 µm for whole-mount and 200 µm for sections in D; 2 mm for whole-mount, 250 µm for i, 500 µm for ii and 100 µm for ii-zoom in E.
Figure 2
Figure 2. Analysis of anterior patterning in cdKO embryos.
Stage matched control and cdKO embryos were analyzed by in situ hybridization with anti-sense probes for Six3, Foxg1 and Fgf8 at 9.0 dpc (A), Hesx1 and Emx2 at 9.0 dpc (B) and Hesx1 and Six3 at 7.25 and 7.5 dpc respectively (C). Stage matched control and cdKO embryos were analyzed at the indicated stages by in situ hybridization for Hex (D), and Foxa2 and Dkk1 (E). Images shown are representative of at least 3 embryos each. Scale bars: 125 µm in A, B, C and D; 250 µm in E.
Figure 3
Figure 3. Defective Shh signaling in the forebrain of cdKO embryos.
(A and B) Stage matched control and cdKO embryos at the indicated ages were analyzed by in situ hybridization for Shh. Whole mount and images of coronal sections through the forebrain vesicle of paraffin-embedded control and cdKO embryos at 9.5 dpc (A) and transverse sections through ventral forebrain and neural tube at 8.75 dpc (B) are shown. The arrows in B indicate the Shh expression in midline tissue. (C) Stage matched control and cdKO embryos at 9.0 dpc were analyzed by in situ hybridization for Gli1 and Ptch1. Brackets in C indicate the expression domain that is reduced in the cdKO. White lines indicate the plane of sections. Images shown are representative of at least 3 embryos. Scale bars: 250 µm for whole-mount and 100 µm for sections in A; 125 µm for whole-mount and 100 µm for sections in B; 250 µm in C.
Figure 4
Figure 4. Rescue of Shh signaling by a reduction in Gli3 levels.
(A) Stage matched control, cdKO, Gli3+/r;cdKO and Shhr/r embryos at 9.0 dpc were analyzed by in situ hybridization for Gli3. (B) Stage matched control, cdKO, Gli3+/r;cdKO and Gli3r/r;cdKO embryos at 9.0 dpc were analyzed by in situ hybridization for Shh. (C) Stage matched control, cdKO, Gli3+/r;cdKO, Shhr/r and Gli3+/r;Shhr/r embryos at 9.0 dpc were analyzed by in situ hybridization for Nkx2.1. Whole mount and coronal sections through the rostral (i) and caudal (ii) forebrain are shown. The white lines indicate the planes of the sections. Embryos shown are representative of at least 3. Scale bars: 250 µm for whole-mount and 50 µm for sections.
Figure 5
Figure 5. Rescued ventral forebrain structure in Gli3 mutant cdKO embryos.
(A) Whole-mount images and H&E stained coronal sections through the forebrain vesicle of control, cdKO and Gli3+/r;cdKO embryos at 10.0 dpc are shown. The white lines indicate the plane of coronal sections. Arrows indicate the division of the nasal field by the neuroepithelium. (B) SEM images of frontal anterior view of control, cdKO and Gli3+/r;cdKO are shown at 8.25 dpc. The arrows indicate the separation of the ventral lips of the cephalic folds in the control, and the partial rescue of this morphology in the Gli3+/r;cdKO, compared to the complete failure in the cdKO (asterisk). (C) Coronal sections of control and cdKO embryos at 9.0 and 10.0 dpc were analyzed by IHC with antibodies for cleaved caspase 3, or by TUNEL at 10.0 dpc. (D) Coronal sections of control and cdKO embryos at 9.0 dpc were analyzed by IHC with antibodies for Histone H3, phosphorylated on serine 10 (pHH3). (E) Coronal sections of control, cdKO and Gli3+/r;cdKO embryos were analyzed by IHC for pHH3 (F) The mitotic index of the forebrain neuroepithelium of control and cdKO embryos at 9.0 or 10.0 dpc, and of Gli3+/r;cdKO at 10.0 dpc was calculated for each section as the percentage of pHH3-stained nuclei. This data is from four control and five cdKO embryos at 9.0 dpc, and three embryos each at 10.0 dpc. Average+s.d. is shown, with the statistical significance as calculated by Student's t-test. Embryos are representative of at least 3 analyzed, unless otherwise noted. Scale bars: 50 µm for sections of 9.0 dpc embryos; 100 µm for sections from 10.0 dpc embryos.
Figure 6
Figure 6. Defective separation of facial features.
(A) Frontal forebrain images of stage matched control, cdKO and Gli3+/r;cdKO embryos analyzed by in situ hybridization for Pax7. (B) Side and ventral views of embryos analyzed for Pax2 expression are shown. The Gli3+/r;cdKO embryos shown in A and B are representative of 7 and 4 embryos respectively, other images are representative of at least 3. Scale bars: 250 µm for Pax2 and Pax7 side view, and 200 µm for Pax2 ventral view.
Figure 7
Figure 7. Effects of Nodal heterozygosity of the cdKO phenotype.
(A) Whole-mount images and H&E stained coronal sections through the forebrain vesicle of control, cdKO and Nodal+/z;cdKO embryos at 10.0 dpc are shown. The white lines indicate the plane of coronal sections. Three Nodal+/z;cdKO embryos are shown that are representative of the three classes of phenotype seen. The numbers of Nodal+/z;cdKO embryos analyzed at 10.0 dpc (from a total of 317 embryos) are shown below for each class of phenotype, together with the percentage of the Nodal+/z;cdKO embryos with each phenotype: Partial rescue of the HPE phenotype; Reduced forebrain (FB); and severe truncation. Two additional embryos were too severely delayed to be classified. Note the improved ventral neuroepithelium morphogenesis in the left hand Nodal+/z;cdKO embryo (arrowhead). The separation of the facial field by the neuroepithelium in the control is indicated by an arrow. (B) Control, cdKO and Nodal+/z;cdKO embryos at 9.0 dpc were analyzed for Fgf8 expression, and for Nkx2.1 expression in (C). Embryos in B and C are representative of at least three each. Scale bars: 250 µm for whole-mount and 100 µm for sections in A; 250 µm in B and C.
Figure 8
Figure 8. Analysis of Fgf8 expression.
(A) Control and Shh null embryos were analyzed for Fgf8 expression at 8.5 and 9.0 dpc. (B) Control, cdKO and Gli3+/r;cdKO embryos were analyzed for Fgf8 expression at 9.5 dpc, and in (C) for Foxg1 expression at 9.5 and 10.0 dpc. Embryos are representative of at least three of each genotype at each stage and 5 each for panel B. Arrows indicate the eye field expression of Foxg1, and show the partial rescue of eye field separation in the Gli3+/r;cdKO embryo (arrowheads). Scale bar: 180 µm at 8.5 dpc and 250 µm at 9.0 dpc in A; 250 µm in B, C and D.
Figure 9
Figure 9. Model for the role of Tgifs in signaling during forebrain development.
A tentative model is shown that describes the data presented here. Briefly, Tgifs limit Smad2 transcriptional activity, which is required for activation of Fgf8 expression. Tgif regulation of the Nodal-Smad2 pathway is required for the correct balance between Gli3 and Shh activity in the Shh pathway. Dashed lines indicate that the links from the Nodal-Smad2 pathway to Shh signaling components may not be direct, and that the regulation may be of both Shh and Gli3, or may occur primarily via one of them.

Similar articles

Cited by

References

    1. Geng X, Oliver G. Pathogenesis of holoprosencephaly. J Clin Invest. 2009;119:1403–1413. - PMC - PubMed
    1. Muenke M, Beachy PA. C.R. S, A.L. B, W.S. S, D. V, B. C, et al., editors. Holoprosencephaly. The metabolic and molecular bases of inherited disease: McGraw-Hill. 2001. pp. 6203–6230.
    1. Leoncini E, Baranello G, Orioli IM, Anneren G, Bakker M, et al. Frequency of holoprosencephaly in the International Clearinghouse Birth Defects Surveillance Systems: searching for population variations. Birth Defects Res A Clin Mol Teratol. 2008;82:585–591. - PubMed
    1. Matsunaga E, Shiota K. Holoprosencephaly in human embryos: epidemiologic studies of 150 cases. Teratology. 1977;16:261–272. - PubMed
    1. Roach E, Demyer W, Conneally PM, Palmer C, Merritt AD. Holoprosencephaly: birth data, genetic and demographic analyses of 30 families. Birth Defects Orig Artic Ser. 1975;11:294–313. - PubMed

Publication types