. 2012 Feb 24:6:8.
doi: 10.3389/fnsys.2012.00008. eCollection 2012.

Network deficiency exacerbates impairment in a mouse model of retinal degeneration

Affiliations

Network deficiency exacerbates impairment in a mouse model of retinal degeneration

Christopher W Yee et al. Front Syst Neurosci. .

Abstract

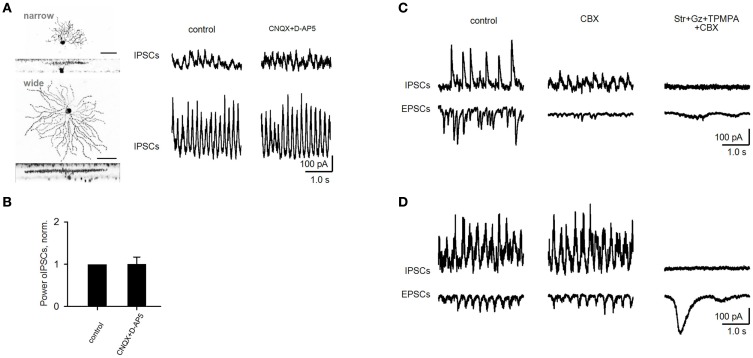
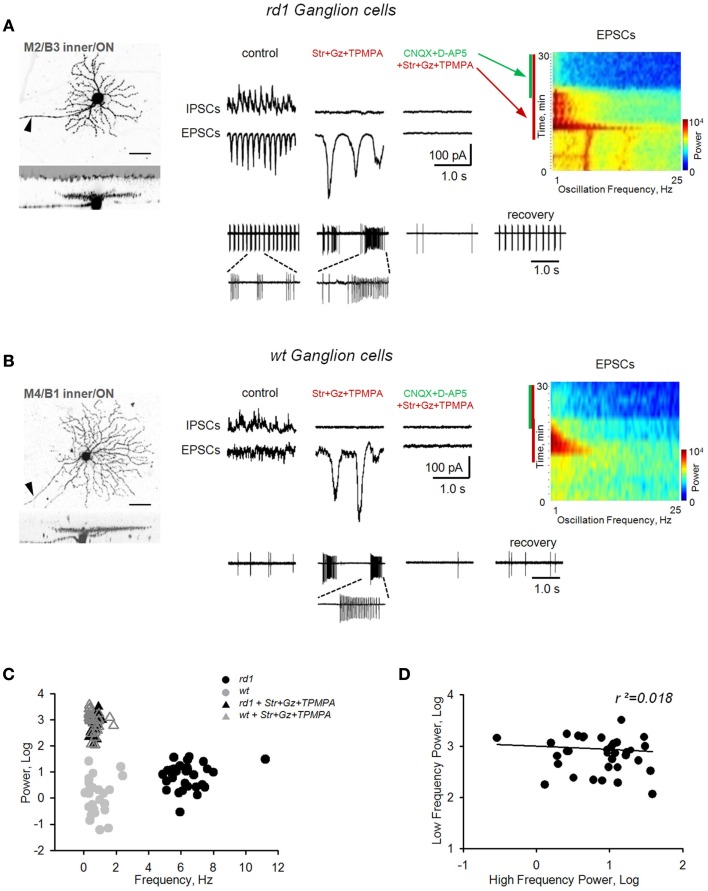
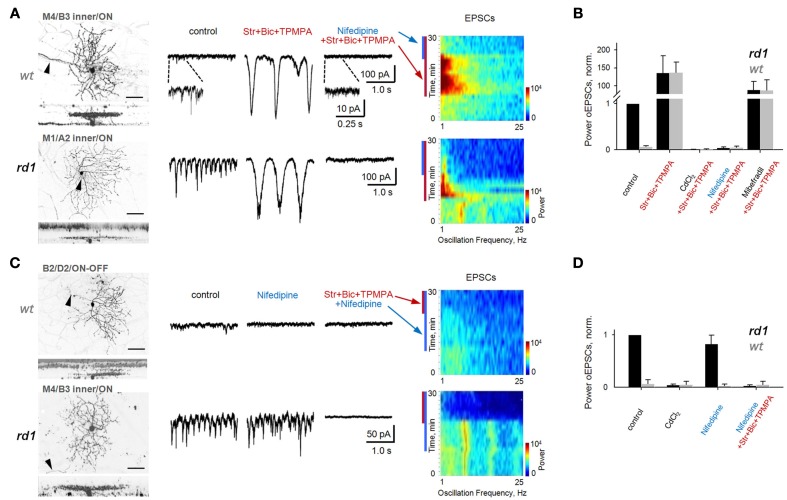
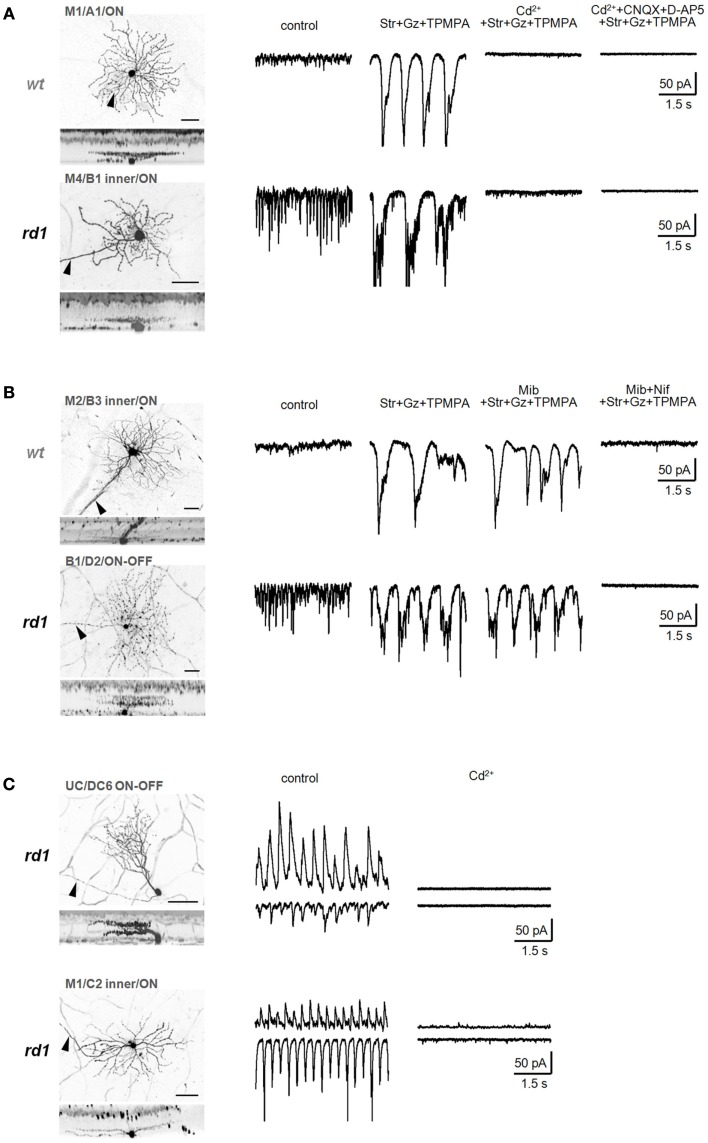
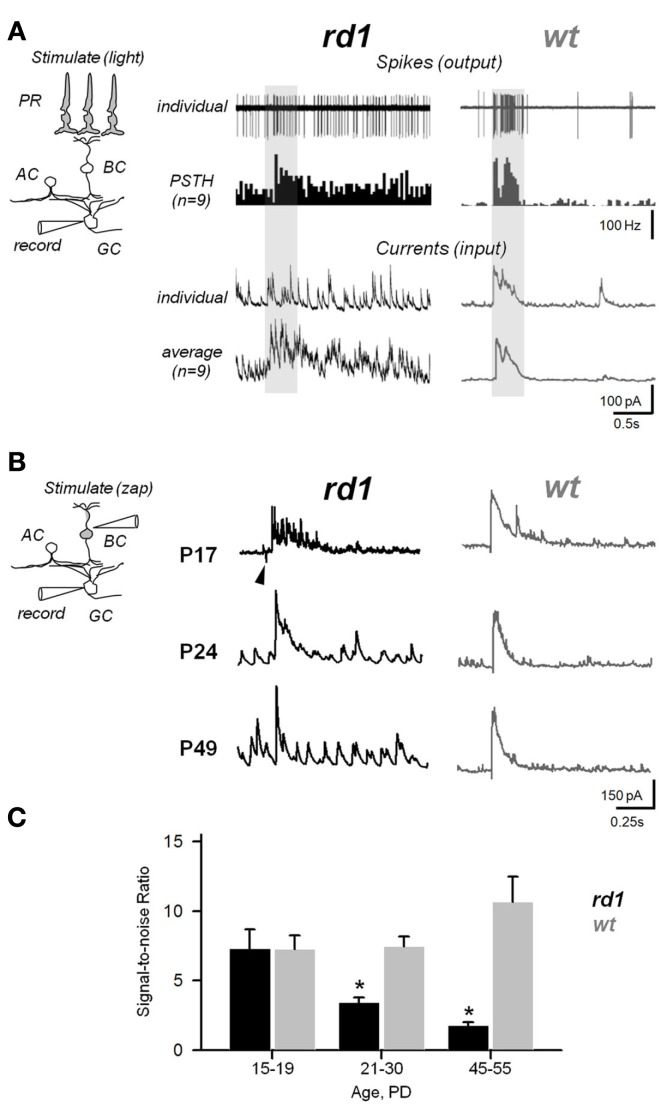
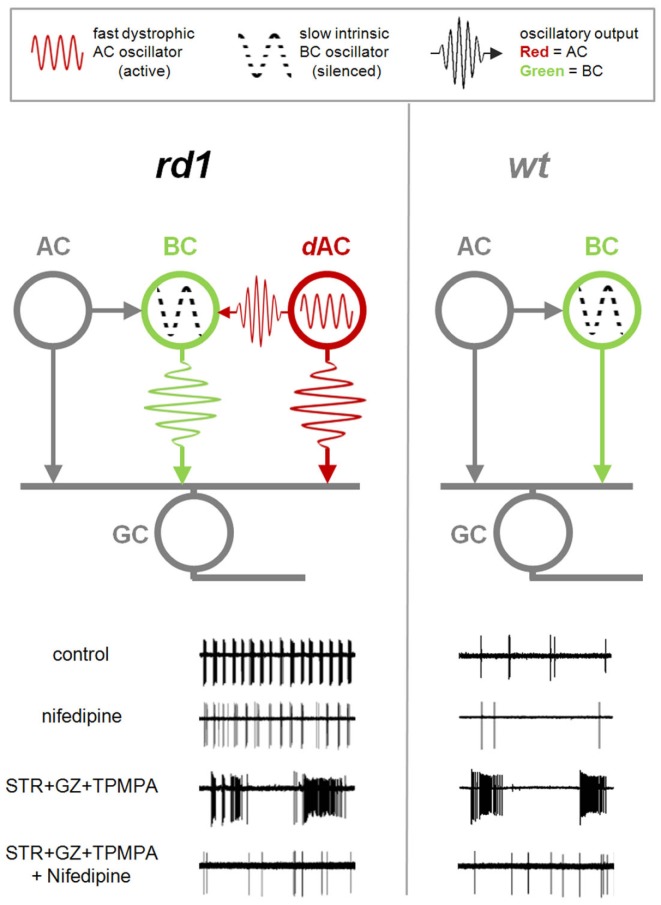
Neural oscillations play an important role in normal brain activity, but also manifest during Parkinson's disease, epilepsy, and other pathological conditions. The contribution of these aberrant oscillations to the function of the surviving brain remains unclear. In recording from retina in a mouse model of retinal degeneration (RD), we found that the incidence of oscillatory activity varied across different cell classes, evidence that some retinal networks are more affected by functional changes than others. This aberrant activity was driven by an independent inhibitory amacrine cell oscillator. By stimulating the surviving circuitry at different stages of the neurodegenerative process, we found that this dystrophic oscillator further compromises the function of the retina. These data reveal that retinal remodeling can exacerbate the visual deficit, and that aberrant synaptic activity could be targeted for RD treatment.

Keywords: functional remodeling; neurodegeneration; oscillations; retinitis pigmentosa; synaptic plasticity.


Figures

Figure 1
Figure 1
Recording procedures and identification of GCs in RD retinal wholemount. Top. The view at the retinal ganglion cell (GC) layer in wholemount retinal preparation. The outlines of individual cell bodies are visible across the field. The recording pipette is targeting one of the GCs (asterisk). Fluorescent image of the same GC with attached recording pipette filled with sulforhodamine B (monochrome image). GCs were distinguished from displaced amacrine cells by the presence of an axon (arrowhead). Following the characterization of excitatory (EPSCs) and inhibitory (IPSCs) inputs and spiking output, the pipette was detached and the detailed dendritic structure was reconstructed using confocal microscopy. A z-stack of 161 images was acquired at 0.5 μm steps at 1024 × 1024 pixel resolution. A nuclear stain (Ethidium Bromide with To-Pro-3, blue) was subsequently added to aid in determining the thickness of the inner plexiform layer (IPL). Scale bar – 20 μm. Bottom. (Left) Spikes and currents recorded from the same cell. (Middle) Arbor area and (Right) depth of the dendritic arbors (AD) were measured as illustrated.
Figure 2
Figure 2
Diverse classes of rd1 GCs exhibit aberrant activity. (A) Representative rd1 GCs from multiple classes, shown with physiological activity. Here and in the following figures, reverse-contrast confocal images are shown, with scale bars adjusted to 40 μm. Cells are labeled by cluster membership, Sun et al. (2002) cell class, and physiological type above each set of images. GCs were distinguished from displaced ACs by the presence of an axon (arrowheads). Whole-cell inhibitory and excitatory currents (IPSCs, EPSCs) and spiking activity are shown for each cell. Scale bars: time 0.5 s, current amplitude 100 pA. (B,C) Dendrograms (left) and scatter plots (right) of the clustering of monostratified and bistratified rd1 GCs, based on dendritic arbor size and depth of arbor stratification. For bistratified cells, both inner and outer arbors were measured.
Figure 3
Figure 3
Oscillatory activity varies between distinct classes of rd1 GCs. (A) Monostratified clusters significantly differed in their E:I ratios (ANOVA, p < 0.001). As a population, there was a significant correlation between stratification and E:I ratio (Pearson’s r = −0.57, p < 0.001, n = 113). (B) Monostratified clusters with larger dendritic fields had a larger percentage of bursting cells than clusters with smaller dendritic fields (data also in Table 1). This difference was greatest in cells that stratified proximally to the GC layer (∼30%). (C) Monostratified clusters with larger dendritic fields had lower E:I ratios compared to clusters with smaller dendritic fields that stratified similarly (Two-way ANOVA, p = 0.008). Above each group, stratification depths are indicated as IPL percentiles. (D) Bistratified clusters did not differ in their E:I ratio (p = 0.56), but inhibitory oscillations had 316 ± 10% the power of excitatory oscillations (t-test, p < 0.001, n = 53). Data are reported as means ± SEM, except in (B), where percentages within groups are reported.
Figure 4
Figure 4
Oscillations persist in rd1 GCs after blockade of iGluRs. Oscillatory activity was evident in both EPSCs and IPSCs. (A) Following application of iGluR antagonists (CNQX, D-AP5), inhibitory oscillations persisted in a majority of GCs. All remaining synaptic activity was eliminated after block of inhibitory receptors. Spectrograms (right panels) are FFT power spectra, plotted over time, demonstrating changes in frequency components of EPSC oscillatory activity across different experimental conditions. In this and subsequent figures, colored bars along the left side of the spectrograms indicate the presence of antagonists. Refinement of oscillations is reflected by narrower frequency bands. (B) Cells that continued to oscillate in the presence of iGluR antagonists were not affected by subsequent addition of carbenoxolone (CBX), a gap junction blocker (p = 0.46, n = 7, paired t-test). All remaining synaptic activity was eliminated after block of inhibitory receptors. (C) Scatterplot of percent change (log units) of inhibitory oscillations in monostratified rd1 GCs from control conditions (horizontal dashed line) following application of iGluR blockers. There was a significant correlation with the depth of GC dendritic ramification in the inner plexiform layer (IPL, r2 = 0.67, p < 0.001, n = 26). (D) Summary bar chart for rd1 GCs under various pharmacological conditions. All data are reported as means ± SEM.
Figure 5
Figure 5
Oscillations in rd1 ACs and variable effect of gap junction blocker on fast oscillations in rd1 GCs. (A) Representative IPSCs from rd1 narrow- and wide-field amacrine cells. (B) Oscillations that persisted in amacrine cells following application of iGluR antagonists did not differ from control conditions (p = 0.19, n = 5, paired t-test). (C,D) Recordings of oscillatory activity in two representative GCs. Application of the gap junction blocker carbenoxolone (CBX, 100 μM) diminishes oscillatory activity in one cell (C), while this activity remained unaffected in another cell (D). In both cells, all high-frequency oscillatory activity was abolished following addition of blockers of inhibitory transmission. Large, low-frequency EPSCs remain [(D), right traces], which are driven by bipolar cells (as shown in Figures 6–8).
Figure 6
Figure 6
Block of inhibition eliminates fast bursting in rd1 retina and reveals slow intrinsic bipolar cell-mediated oscillations in both rd1 and wt retinas. Application of inhibitory receptor blockers (strychnine, gabazine, TPMPA) eliminated fast oscillations in rd1, but induced large, slow oscillations in both rd1 (A) and wt (B) GCs. These slow oscillations were eliminated after subsequent block of iGluRs. (C) Cluster analysis shows that slow oscillations did not differ between wt and rd1 GCs. (D) Regression analysis shows no relationship between fast dystrophic oscillations and slow oscillations across rd1 GCs (r2 = 0.018).
Figure 7
Figure 7
Block of L-type voltage-gated Ca2+-channels does not eliminate fast aberrant excitatory oscillations but abolishes slow intrinsic BC oscillations. Spontaneous EPSCs are shown from GCs in age-matched adult wt and rd1 wholemount retinas. In control conditions, fast oscillations were present in rd1, but not wt, GCs (left traces). (A) Block of inhibition unveiled large, slow oscillations in both rd1 and wt GCs (middle traces), which are visible as high-power, low-frequency bands (spectrograms). Application of nifedipine (50 μM), a selective L-type voltage-gated Ca2+-channel antagonist, abolished slow oscillations (right traces). (B) Summary bar chart for wt and rd1 GCs (n = 10, 10). The power of oscillatory EPSCs was normalized to those of rd1 GCs in control conditions. Slow oscillations were abolished by application of either CdCl2 to block all voltage-gated Ca2+-channels, or of nifedipine, to block L-type channels. Block of T-type Ca2+-channels with mibefradil reduced the power of oscillatory EPSCs, but did not abolish them. (C) Application of nifedipine in both wt and rd1 GCs prevented the generation of slow oscillations with subsequent block of inhibition. In contrast, in rd1 GCs, nifedipine did not abolish aberrant fast oscillations, but block of inhibition did (bottom traces). The spectrogram shows that the high-frequency oscillations are present both in control conditions and after the addition of nifedipine in rd1 (p = 0.12, paired t-test). (D) Summary bar chart for 10 wt and 10 rd1 GCs. See also Figure 8. All data are reported as means ± SEM.
Figure 8
Figure 8
Calcium signals underlying two distinct oscillators. (A) Isolated low-frequency EPSC oscillations recorded from identified wt (top) and rd1 (bottom) GCs were eliminated by a non-selective voltage-gated Ca2+ channel blocker, CdCl2 (200 μM). (B) Bipolar cell-mediated oscillations were slightly reduced by mibefradil (5 μM), a selective T-type voltage-gated Ca2+-channel blocker, and completely abolished by nifedipine (30 μM), a selective L-type voltage-gated Ca2+-channel blocker, in both wt (top) and rd1 (bottom) GCs. (C) Ca2+ influx is required for amacrine cell-mediated high-frequency oscillations in rd1. In representative rd1 GCs, both oscillatory EPSCs and IPSCs were eliminated by CdCl2 (200 μM). Summary histograms are shown in Figure 6. In confocal images, scale bars are adjusted to 40 μm.
Figure 9
Figure 9
Aberrant activity compromises efficiency of synaptic transmission within the inner retina during RD. (A) Photoreceptor-dependent light-evoked spiking responses from GCs in rd1 and age-matched wt controls (P20–P26). Peristimulus time histograms (PSTHs) were generated with 0.1 ms bins. The recording paradigm is illustrated in the insert (PR, photoreceptor; BC, bipolar; AC, amacrine; GC, ganglion cells). Shaded area – timing of the light stimulus (∼300 μm light spot). (B) Photoreceptor-independent synaptically evoked activity from voltage-clamped GCs in rd1 mice at different phases of retinal remodeling and age-matched wildtype controls. A current pulse was delivered to the INL, bypassing photoreceptors. Arrowhead indicates stimulus artifact. (C) Signal-to-noise ratios at different ages in rd1 (black bars, n = 21) and wt (gray bars, n = 15). As RD progresses, increasing noise levels obscure the evoked response. All data are reported as means ± SEM; p < 0.001.
Figure 10
Figure 10
Dystrophic amacrine cell input drives bursting activity in RD. Diagrams of the synaptic interactions in rd1 (left) and wt (right) retinas. Bipolar cells (BC) provide excitatory drive to ganglion cells (GC) and amacrine cells (AC). Amacrine cells, in turn, modulate the GC activity via presynaptic inhibition of BCs, and direct inhibition of GCs. In both RD and healthy retina, an intrinsic slow BC oscillator is silent in resting conditions. In rd1 retina, an additional fast dystrophic AC oscillator is active, and affects both BC and GC output. Lower panels show GC spiking output at different conditions. In control conditions, GCs in RD retina show fast bursting activity driven by the AC oscillator. This fast bursting persists with nifedipine. In contrast, application of inhibitory blockers (STR + GZ + TPMPA) unveils the BC oscillator, which is present in both rd1 and wt, but silent in control conditions. Unlike fast oscillations this slow oscillator is abolished by nifedipine.

Similar articles

Cited by

References

    1. Badea T. C., Nathans J. (2004). Quantitative analysis of neuronal morphologies in the mouse retina visualized by using a genetically directed reporter. J. Comp. Neurol. 480, 331–351.10.1002/cne.20304 - DOI - PubMed
    1. Berntson A., Taylor W. R., Morgans C. W. (2003). Molecular identity, synaptic localization, and physiology of calcium channels in retinal bipolar cells. J. Neurosci. Res. 71, 146–151.10.1002/jnr.10459 - DOI - PubMed
    1. Berson D. M., Dunn F. A., Takao M. (2002). Phototransduction by retinal ganglion cells that set the circadian clock. Science 295, 1070–1073.10.1126/science.1067262 - DOI - PubMed
    1. Borowska J., Trenholm S., Awatramani G. B. (2011). An intrinsic neural oscillator in the degenerating mouse retina. J. Neurosci. 31, 5000–5012.10.1523/JNEUROSCI.5800-10.2011 - DOI - PMC - PubMed
    1. Borowska J. T., Trenholm S., Awatramani G. B. (2010). Intrinsic mechanisms in bipolar cells drive spontaneous network activity during retinal degeneration. ARVO Meet Abstr. 51, 2486.