. 2012 Feb 24:6:9.
doi: 10.3389/fnsys.2012.00009. eCollection 2012.

Gamma-aminobutyric acid and glutamic acid levels in the auditory pathway of rats with chronic tinnitus: a direct determination using high resolution point-resolved proton magnetic resonance spectroscopy (H-MRS)

Affiliations

Gamma-aminobutyric acid and glutamic acid levels in the auditory pathway of rats with chronic tinnitus: a direct determination using high resolution point-resolved proton magnetic resonance spectroscopy (H-MRS)

Thomas Brozoski et al. Front Syst Neurosci. .

Abstract

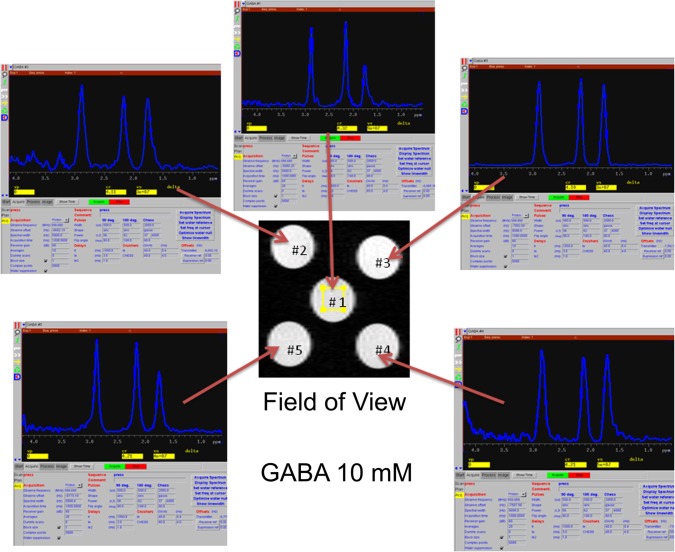
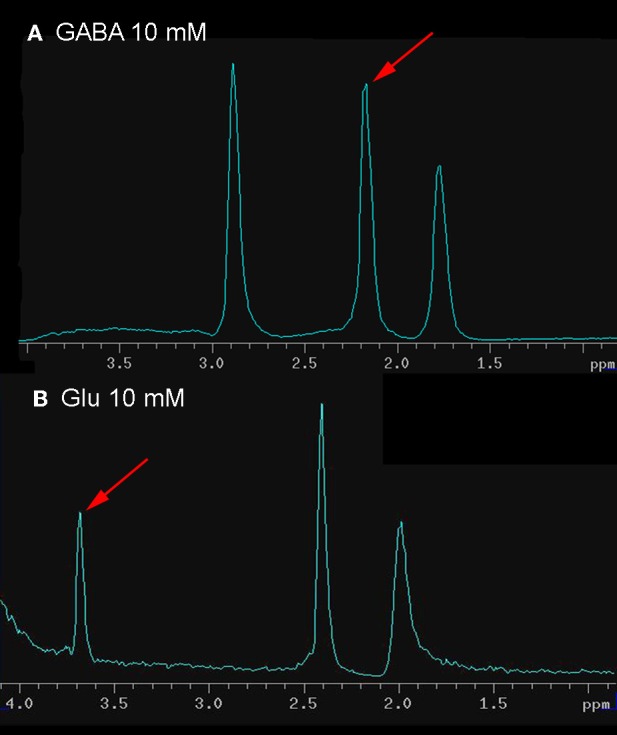
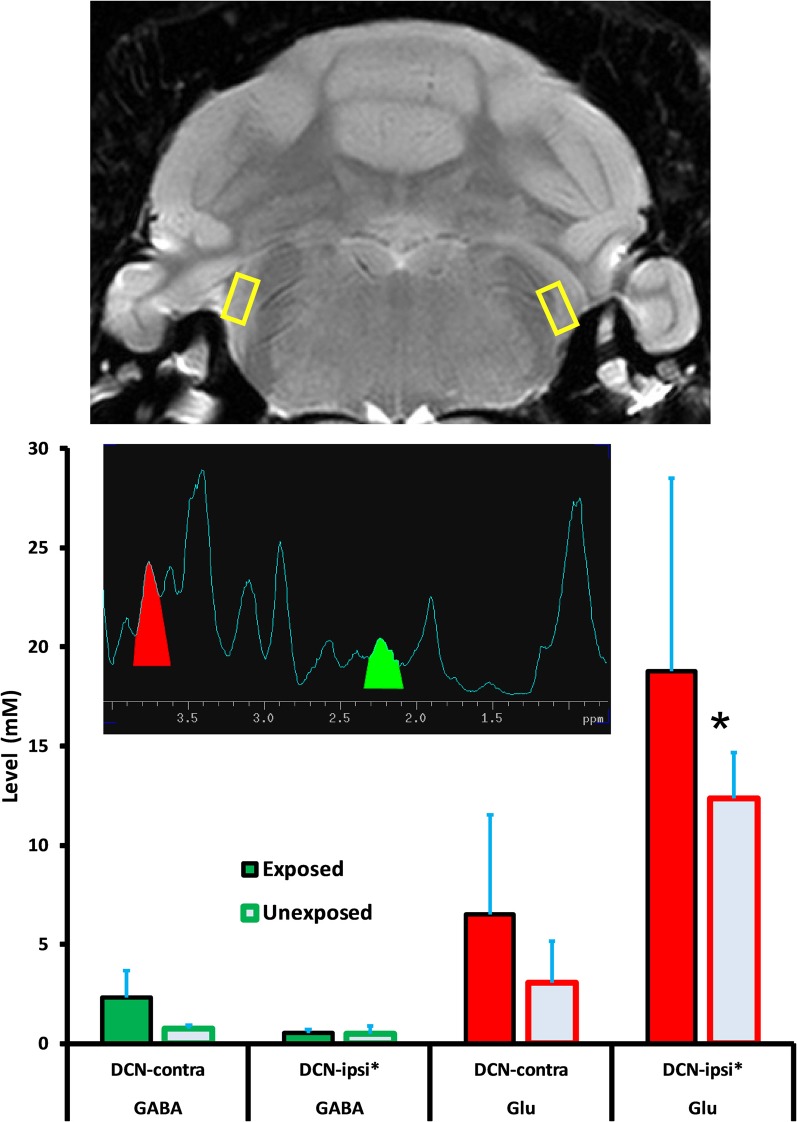
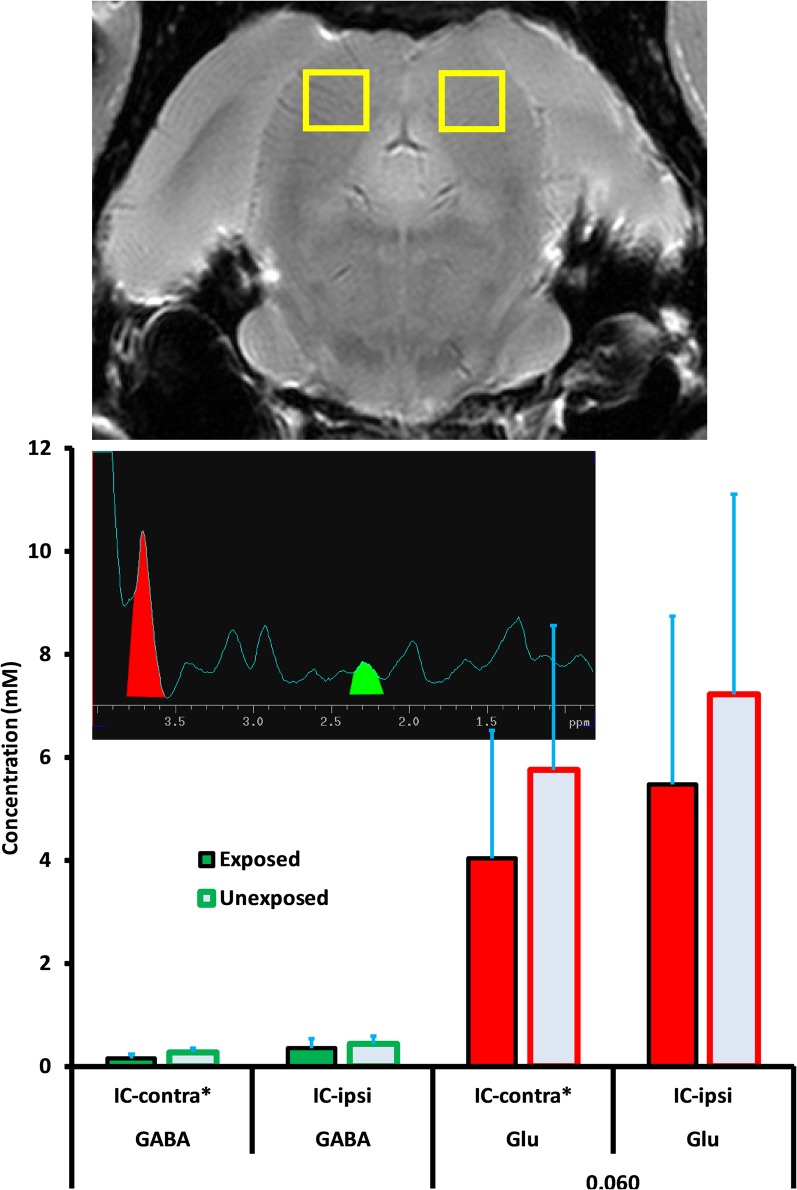
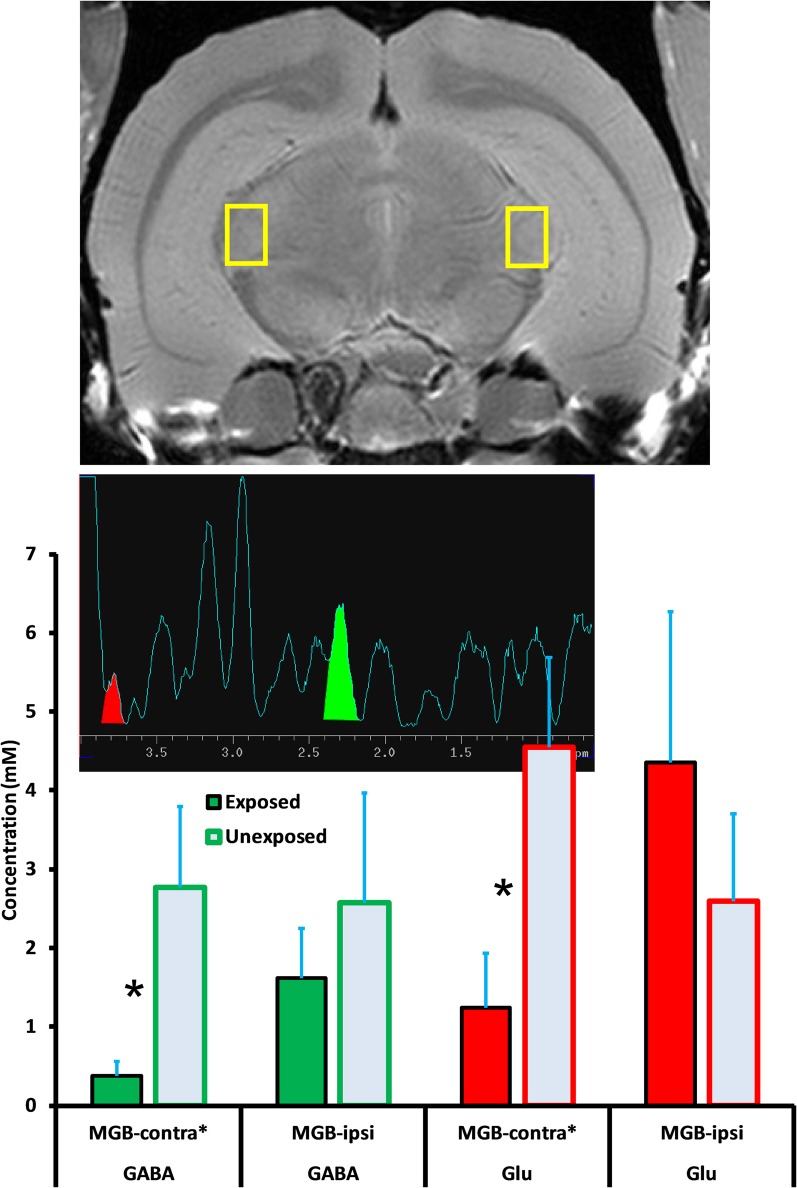
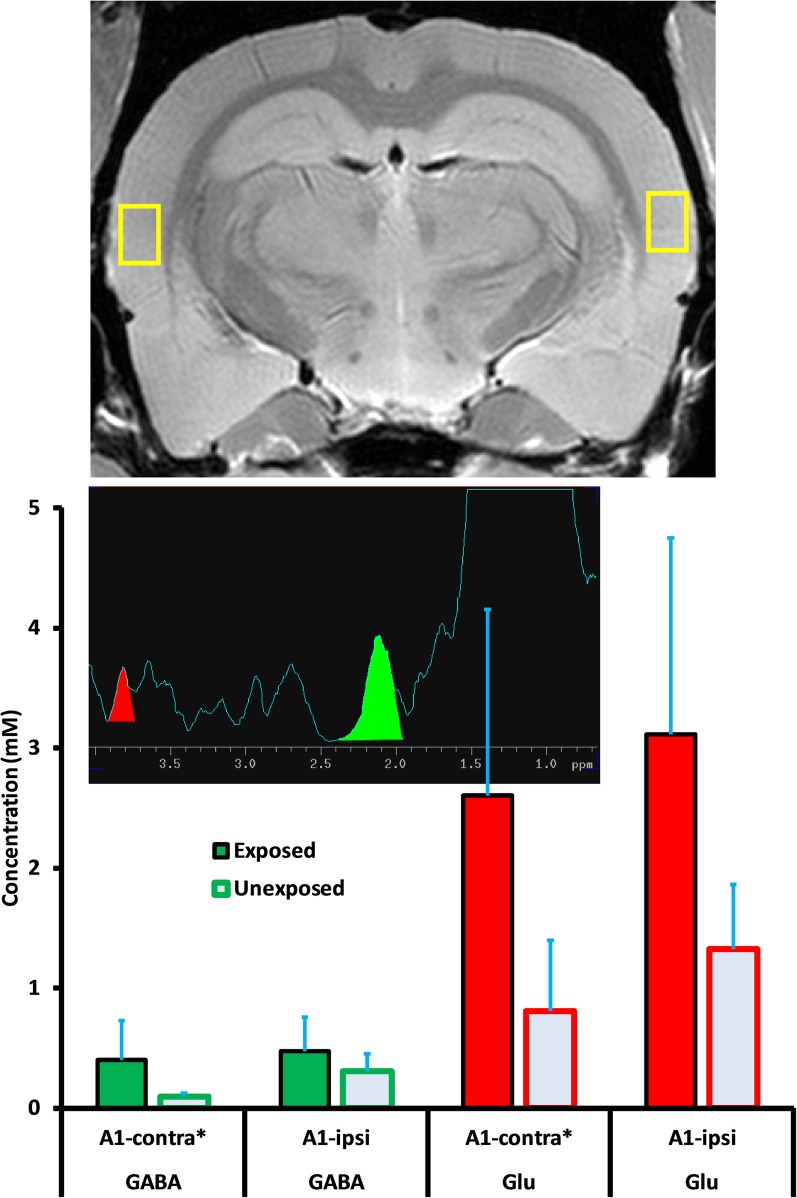
Damage to the auditory system following high-level sound exposure reduces afferent input. Homeostatic mechanisms appear to compensate for the loss. Overcompensation may produce the sensation of sound without an objective physical correlate, i.e., tinnitus. Several potential compensatory neural processes have been identified, such as increased spontaneous activity. The cellular mechanisms enabling such compensatory processes may involve down-regulation of inhibitory neurotransmission mediated by γ-amino butyric acid (GABA), and/or up-regulation of excitatory neurotransmission, mediated by glutamic acid (Glu). Because central processing systems are integrated and well-regulated, compensatory changes in one system may produce reactive changes in others. Some or all may be relevant to tinnitus. To examine the roles of GABA and Glu in tinnitus, high resolution point-resolved proton magnetic resonance spectroscopy ((1)H-MRS) was used to quantify their levels in the dorsal cochlear nucleus (DCN), inferior colliculus (IC), medial geniculate body (MGB), and primary auditory cortex (A1) of rats. Chronic tinnitus was produced by a single high-level unilateral exposure to noise, and was measured using a psychophysical procedure sensitive to tinnitus. Decreased GABA levels were evident only in the MGB, with the greatest decrease, relative to unexposed controls, obtained in the contralateral MGB. Small GABA increases may have been present bilaterally in A1 and in the contralateral DCN. Although Glu levels showed considerable variation, Glu was moderately and bilaterally elevated both in the DCN and in A1. In the MGB Glu was increased ipsilaterally but decreased contralaterally. These bidirectional and region-specific alterations in GABA and Glu may reflect large-scale changes in inhibitory and excitatory equilibrium accompanying chronic tinnitus. The present results also suggest that targeting both neurotransmitter systems may be optimal in developing more effective therapeutics.

Keywords: 1H-MRS; GABA; dorsal cochlear nucleus; glutamate; inferior colliculus; medial geniculate; primary auditory cortex; tinnitus animal model.


Figures

Figure 1
Figure 1
Calibration of GABA spectra using an array of phantoms, each containing 10 mM GABA in sterile normal saline, distributed across the imaging field of view. Using multiple phantoms arrayed throughout the field of view illustrates optimized field shimming and selection of the least-variant spectral peak, from among the multiplets at each location, used to quantify the compound of interest (in this example, GABA).
Figure 2
Figure 2
Calibration spectra of GABA and Glu, obtained using the same scanning parameters (see Methods for details) used to capture VOI spectra. The peak, from among the multiplets, used to quantify GABA and Glu is shown by the pointer.
Figure 3
Figure 3
Examples of tinnitus in individual rats. (A) A rat with focal narrow-band tinnitus in the vicinity of 20 kHz, and (B) A rat with rather broad-band tinnitus localized between 10 and 24 kHz. Error bars show the standard error of the mean of the unexposed group. Relative rate of lever pressing, as indicated by the suppression ratio (see Text), is shown on the y-axis, and test stimulus across stimulus levels (dB, SPL) is shown on the x-axis.
Figure 4
Figure 4
Frequency-specific group evidence of tinnitus. The statistics in each panel represent a comparison of exposed and unexposed groups for stimulus levels above the OFF setting. As in Figure 3, relative lever pressing is shown on the y-axis and test stimulus across levels is shown on the x-axis. Error bars show the standard error of the mean.
Figure 5
Figure 5
GABA and Glu levels (mM/ml) in the dorsal cochlear nucleus (DCN) of exposed and unexposed rats. Top panel: size and location of the VOI; Mid panel: a typical individual 1H-MRS; Lower panel: group average GABA and Glu levels. Error bars show the standard error of the mean. Asterisk next to the axis label indicates the direct pathway with respect to the trauma-exposed ear. Asterisk next to the data bar indicates statistical significance (p ≤ 0.05).
Figure 6
Figure 6
GABA and Glu levels (mM/ml) in the inferior colliculus (IC) of exposed and unexposed rats. No significant differences were obtained between exposed and unexposed animals in the IC. Graphic parameters as in Figure 5.
Figure 7
Figure 7
GABA and Glu levels (mM/ml) in the medial geniculate body (MGB) of exposed and unexposed rats. GABA and Glu concentrations were significantly lower in the contralateral MGB of exposed animals. Graphic parameters as in Figure 5.
Figure 8
Figure 8
GABA and Glu levels (mM/ml) in primary auditory cortex (A1) of exposed and unexposed rats. Although differences between exposed and unexposed animals were not statistically significant, significance levels may have been masked by measurement variability stemming from field anisotropy rather that neurochemical variability. Graphic parameters as in Figure 5.
Figure 9
Figure 9
Auditory brainstem response thresholds for exposed and unexposed rats. Top panel: thresholds before and immediately after acoustic exposure. Significant threshold elevation was evident only in the exposed ear. Bottom panel: thresholds prior to spectroscopy show normal levels in both groups. Error bars show the standard error of the mean.

References

    1. Bauer C. A., Brozoski T. J. (2001). Assessing tinnitus and prospective tinnitus therapeutics using a psychophysical animal model. J. Assoc. Res. Otolaryngol. 2, 54–64. - PMC - PubMed
    1. Bauer C. A., Turner J. G., Caspary D. M., Myers K. S., Brozoski T. J. (2008). Tinnitus and inferior colliculus activity in chinchillas related to three distinct patterns of cochlear trauma. J. Neurosci. Res. 86, 2564–2578. 10.1002/jnr.21699 - DOI - PMC - PubMed
    1. Brozoski T. J., Bauer C. A. (2008). Learning about tinnitus from an animal model. Semin. Hear. 29, 242–258.
    1. Brozoski T. J., Bauer C. A., Caspary D. M. (2002). Elevated fusiform cell activity in the dorsal cochlear nucleus of chinchillas with psychophysical evidence of tinnitus. J. Neurosci. 22, 2383–2390. - PMC - PubMed
    1. Brozoski T. J., Caspary D. M., Bauer C. A., Richardson B. D. (2010). The effect of supplemental dietary taurine on tinnitus and auditory discrimination in an animal model. Hear. Res. 270, 71–80. 10.1016/j.heares.2010.09.006 - DOI - PMC - PubMed