

Calculating ensemble averaged descriptions of protein rigidity without sampling
- PMID: 22383947
- PMCID: PMC3285152
- DOI: 10.1371/journal.pone.0029176
Calculating ensemble averaged descriptions of protein rigidity without sampling
Abstract
Previous works have demonstrated that protein rigidity is related to thermodynamic stability, especially under conditions that favor formation of native structure. Mechanical network rigidity properties of a single conformation are efficiently calculated using the integer body-bar Pebble Game (PG) algorithm. However, thermodynamic properties require averaging over many samples from the ensemble of accessible conformations to accurately account for fluctuations in network topology. We have developed a mean field Virtual Pebble Game (VPG) that represents the ensemble of networks by a single effective network. That is, all possible number of distance constraints (or bars) that can form between a pair of rigid bodies is replaced by the average number. The resulting effective network is viewed as having weighted edges, where the weight of an edge quantifies its capacity to absorb degrees of freedom. The VPG is interpreted as a flow problem on this effective network, which eliminates the need to sample. Across a nonredundant dataset of 272 protein structures, we apply the VPG to proteins for the first time. Our results show numerically and visually that the rigidity characterizations of the VPG accurately reflect the ensemble averaged [Formula: see text] properties. This result positions the VPG as an efficient alternative to understand the mechanical role that chemical interactions play in maintaining protein stability.
Conflict of interest statement
Figures

 ) are calculated by averaging across an ensemble of binary networks where H-bonds are either present or not. Conversely, the VPG describes the network with H-bond probabilities.
 and
and  ), whereas the capacities of edges
  ,
,  , and
, and  is, respectively, 0.6, 5.0, 5.0. If a hypothetical edge is added between any pair of vertices, there is always going to be possible to find DOF, therefore the three vertices result in single bodies (highlighted by color differences). Conversely, in the second example, (b), only the six trivial DOF can be found (on vertex
  ). That is, no free pebbles remain in the network (they have all be consumed by the edges). As such, the five vertices belong to a single rigid cluster.
 for four exemplar proteins that span a range of sizes (from 64 to 315 residues) and topological architectures. All proteins across the full dataset have the same characteristic shape where the minima in RM is related to the protein structure's rigidity transition. The
  value corresponding to the worst RM is defined as
  . (b) Histogram detailing
  values for each protein within our dataset. Encouragingly, an overwhelming majority of cases have RMs greater than
  . (c) Histogram detailing the agreement measure for each backbone torsion within our dataset at each protein's respective
  value. (d) Histogram detailing the Pearson correlation coefficient comparing the
  and VPG mechanical coupling maps across the dataset at each protein's respective
  value.
 . The middle column corresponds to the rigid clusters identified by the VPG. Finally, differences between the two algorithms are highlighted in the third column.
 values. (d) Differences between the
  and VPG are mapped to the ribosylglycohydrolase structure from M. jannaschii, which is presented as a typical case. Red coloring indicates that the VPG overestimates rigidity relative to
  , whereas blue indicates an underestimate. Across our dataset, as shown in this example, differences occur most frequently in loop regions.
 results are presented in the upper triangle, whereas the VPG is presented in the lower. At
  , the protein is mostly flexible due to a lack of crosslinking H-bonds. However, the structure becomes increasingly rigid as H-bonds are added to the network. At
  , the VPG slightly under-predicts the extent of rigidity. For this protein
  .
.
 results are presented in the upper triangle, whereas the VPG is presented in the lower. Note that the presented proteins are the same from Fig. 3a.
 values for the same four proteins presented Figs. 3a and 7.
 and the VPG. In all cases, the
  to VPG similarity is greater than the 75th percentile of the intrinsic fluctuations within the PG ensemble.
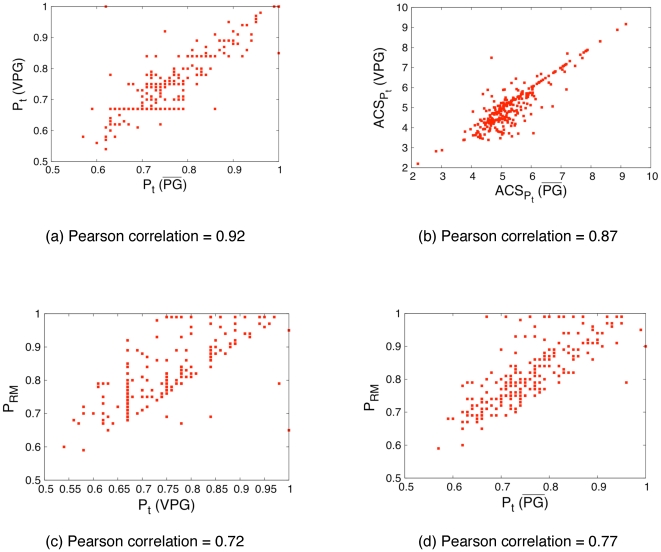
 ) is compared across the
 and VPG algorithms. (b) Similarly, the average cluster size (ACS) at their respective
  values are compared across the two algorithms. The value of
  with the worst RM (called
  ) is compared to
  calculated using the (c) VPG and (d)
  . The linear relationships occur because the mean field approximation is maximally inaccurate in this range. Note, a few proteins do not have completed peaks in their rigid cluster susceptibility curves because the protein never crosses the rigidity transition, which have been excluded from panels (c) and (d).
Similar articles
-
A virtual pebble game to ensemble average graph rigidity.Algorithms Mol Biol. 2015 Mar 18;10:11. doi: 10.1186/s13015-015-0039-3. eCollection 2015. Algorithms Mol Biol. 2015. PMID: 25904973 Free PMC article.
-
Protein flexibility predictions using graph theory.Proteins. 2001 Aug 1;44(2):150-65. doi: 10.1002/prot.1081. Proteins. 2001. PMID: 11391777
-
Using the COREX/BEST server to model the native-state ensemble.Methods Mol Biol. 2014;1084:255-69. doi: 10.1007/978-1-62703-658-0_14. Methods Mol Biol. 2014. PMID: 24061926 Free PMC article.
-
Ensemble-based methods for describing protein dynamics.Curr Opin Pharmacol. 2010 Dec;10(6):760-9. doi: 10.1016/j.coph.2010.09.014. Epub 2010 Oct 19. Curr Opin Pharmacol. 2010. PMID: 20965786 Free PMC article. Review.
-
Principles of docking: An overview of search algorithms and a guide to scoring functions.Proteins. 2002 Jun 1;47(4):409-43. doi: 10.1002/prot.10115. Proteins. 2002. PMID: 12001221 Review.
Cited by
-
Variations within class-A β-lactamase physiochemical properties reflect evolutionary and environmental patterns, but not antibiotic specificity.PLoS Comput Biol. 2013;9(7):e1003155. doi: 10.1371/journal.pcbi.1003155. Epub 2013 Jul 18. PLoS Comput Biol. 2013. PMID: 23874193 Free PMC article.
-
Towards accurate modeling of noncovalent interactions for protein rigidity analysis.BMC Bioinformatics. 2013;14 Suppl 18(Suppl 18):S3. doi: 10.1186/1471-2105-14-S18-S3. Epub 2013 Nov 5. BMC Bioinformatics. 2013. PMID: 24564209 Free PMC article.
-
A virtual pebble game to ensemble average graph rigidity.Algorithms Mol Biol. 2015 Mar 18;10:11. doi: 10.1186/s13015-015-0039-3. eCollection 2015. Algorithms Mol Biol. 2015. PMID: 25904973 Free PMC article.
References
-
- Swier MC, Chong LT. Reaching biological timescales with all-atom molecular dynamics simulations. Curr Opin Pharmacol. 2010;10(6):745–752. - PubMed
-
- Rader AJ. Coarse-grained models: getting more with less. Curr Opin Pharmacol. 2010;10(6):753–759. - PubMed
-
- Jacobs DJ, Rader AJ, Kuhn LA, Thorpe MF. Protein exibility predictions using graph theory. Proteins: Struct Funct and Genet. 2001;44(2):150–165. - PubMed
Publication types
MeSH terms
Substances
Grants and funding
LinkOut - more resources
Full Text Sources
